A montage of Jupiter and its volcanic moon Io, taken during by the New Horizons spacecraft – en route to Pluto – in early 2007. Notice the volcanic plume above Io’s darkened surface. Image via NASA/Johns Hopkins University Applied Physics Laboratory/Southwest Research Institute/Goddard Space Flight Center/Cosmos.
When we hear about volcanoes, we naturally tend to think of some of Earth’s most famous ones, including the Hawaiian volcanoes, Krakatoa or Mount St. Helens. Earth is a very volcanically active place; however, it is not the most active in the solar system. That would be Jupiter’s moon Io.
We on Earth first learned about Io’s volcanoes nearly 40 years ago, when NASA’s Voyager 1 spacecraft flew past this Jovian moon. Now, scientists have completed a comprehensive new peer-reviewed report on Io’s volcanoes, first published in The Astrophysical Journal on June 21, 2019, based on ground-based observations. The report covers five years of observations from 2013-2018, using advanced instrumentation on the Keck and Gemini telescopes.
Scientists had already known how volcanically active Io is. Its surface is dotted with hundreds of active volcanoes, despite this moon’s small size and its location at Jupiter’s orbit, much farther from the sun than Earth, in a much-colder part of the solar system. The new study shows, again, that Io is essentially continuously erupting, and it also reveals some new mysteries. In other words, nearly 40 years after Voyager 1’s momentous discovery, Io’s volcanoes aren’t behaving exactly as scientists expected.
For example, there are volcanoes in the “wrong” places, with the biggest eruptions mostly limited to a single hemisphere on Io. And Loki Patera – an 8,100-square-mile caldera filled with lava and Io’s most active volcano – is an enigma in itself.
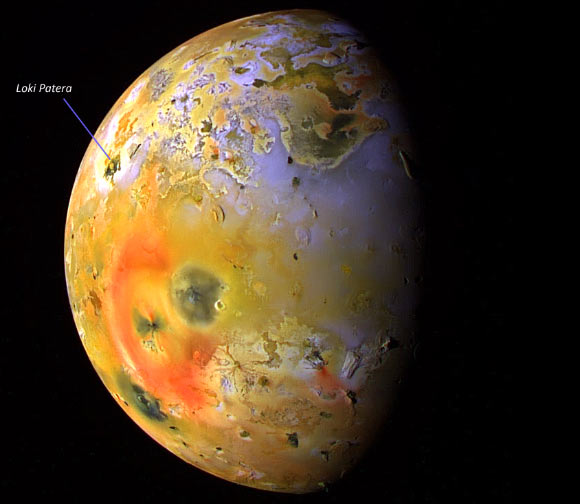
NASA’s Galileo spacecraft obtained this view of Io on September 19, 1997, at a range of more than 310,000 miles (500,000 km). In this image, deposits of sulfur dioxide frost appear in white and gray hues while yellowish and brownish hues are probably due to other sulfurous materials. Bright red materials and dark spots with low brightness mark areas of recent volcanic activity and are usually associated with high temperatures and surface changes. Image via NASA/JPL/University of Arizona/Sci-News.com.

An erupting volcano on Io, as seen by NASA’s Galileo spacecraft in November 1997. Image via NASA/JPL/University of Arizona/NASA Science|Solar System Exploration.
The kinds of eruptions occurring now on Io are also thought to be similar to ones on Earth when it was much younger. As Ashley Davies, a volcanologist at NASA’s Jet Propulsion Laboratory said simply:
It’s a window into Earth’s past.
Loki Patera, the source of 10 percent of Io’s heat output, shows an odd pattern of brightening and dimming. The pattern was found by combining old and new data, and repeats about every 460-480 days, which is consistent with repeated variations in Io’s elliptical orbit. But the pattern isn’t always consistent. An eruption was predicted for May 2018, and it happened, but then the scientists predicted another big eruption September of this year, and it came early, in early July, ending just a few days later. As noted by Julie Rathbun, a scientist at the Planetary Science Institute:
We need to stop naming features after trickster gods!
Scientists aren’t sure yet why Loki Patera brightens and dims the way it does, but it may have something to do with a nearby lava lake that regenerates. When parts of the lava lake cool, they sink beneath the surface, possibly triggering a progressive, sweeping wave pattern seen at the surface. Wow … yes?
Another mystery is why the biggest eruptions tend to occur on the trailing hemisphere of Io, as it orbits Jupiter. Why this disparity?

Io is just slightly larger than our moon and Europa. Image via Galileo’s Pendulum.
Also, computer models predicted that Io’s volcanoes should be concentrated either near the poles or near the equator. But that’s not what is seen, and so there is an unexplained mismatch.
Scientists also still don’t know what the subsurface of Io is really like. It’s been theorized that there is an underground ocean of magma but there may actually just be pockets of magma instead, or even a fluid-filled sponge layer.
Io’s volcanic eruptions can also be very powerful, with one blast sometimes causing the moon’s brightness to double. But that itself is another mystery. Katherine de Kleer, a scientist at the California Institute of Technology, saw three of them in just two weeks in 2013, but then nothing for the next five years:
That’s weird. Where are they?
The weirdness of Io’s volcanoes is an opportunity to not only understand the Jovian moon itself better, but also volcanism on other solar system bodies, including Earth. As Alfred McEwen, a planetary geologist at the University of Arizona, noted:
The history of volcanology is that you look at ancient deposits and you’re puzzled. Then you see it erupt, and then you go, Ah-ha, now I understand.

A mosaic of images of Io’s south polar region, from Voyager 1. Image via NASA/JPL/USGS/Universe Today.
Since Io is continuously erupting, its surface is covered by sulfur lava flows new and old, giving it a very colorful and mottled appearance. That surface is no more than a couple million years old at the most at any given time, even though Io itself is about 4.5 billion years old. The moon has been described as basically turning itself inside out on an ongoing basis, thanks to Jupiter’s powerful gravity tugging at its insides. The lava flows can reach 3,000 degrees Fahrenheit (1650 Celsius) in temperature, although the surface temperature on average is -202 degrees F (-130 C). This is because Io has virtually no atmosphere to trap heat, much like our own moon.
Io’s volcanoes may be reminiscent of Earth’s, but they seem to “dance to their own tune” as it were, behaving in unexpected and puzzling ways. Io is a very strange and alien place.
Bottom line: Not only is Io the most volcanically active body in the solar system, its volcanoes are also some of the most unusual. This new report highlights Io’s most puzzling mysteries.
Source: Io’s Volcanic Activity from Time Domain Adaptive Optics Observations: 2013–2018
from EarthSky https://ift.tt/2Ku5akW
A montage of Jupiter and its volcanic moon Io, taken during by the New Horizons spacecraft – en route to Pluto – in early 2007. Notice the volcanic plume above Io’s darkened surface. Image via NASA/Johns Hopkins University Applied Physics Laboratory/Southwest Research Institute/Goddard Space Flight Center/Cosmos.
When we hear about volcanoes, we naturally tend to think of some of Earth’s most famous ones, including the Hawaiian volcanoes, Krakatoa or Mount St. Helens. Earth is a very volcanically active place; however, it is not the most active in the solar system. That would be Jupiter’s moon Io.
We on Earth first learned about Io’s volcanoes nearly 40 years ago, when NASA’s Voyager 1 spacecraft flew past this Jovian moon. Now, scientists have completed a comprehensive new peer-reviewed report on Io’s volcanoes, first published in The Astrophysical Journal on June 21, 2019, based on ground-based observations. The report covers five years of observations from 2013-2018, using advanced instrumentation on the Keck and Gemini telescopes.
Scientists had already known how volcanically active Io is. Its surface is dotted with hundreds of active volcanoes, despite this moon’s small size and its location at Jupiter’s orbit, much farther from the sun than Earth, in a much-colder part of the solar system. The new study shows, again, that Io is essentially continuously erupting, and it also reveals some new mysteries. In other words, nearly 40 years after Voyager 1’s momentous discovery, Io’s volcanoes aren’t behaving exactly as scientists expected.
For example, there are volcanoes in the “wrong” places, with the biggest eruptions mostly limited to a single hemisphere on Io. And Loki Patera – an 8,100-square-mile caldera filled with lava and Io’s most active volcano – is an enigma in itself.
NASA’s Galileo spacecraft obtained this view of Io on September 19, 1997, at a range of more than 310,000 miles (500,000 km). In this image, deposits of sulfur dioxide frost appear in white and gray hues while yellowish and brownish hues are probably due to other sulfurous materials. Bright red materials and dark spots with low brightness mark areas of recent volcanic activity and are usually associated with high temperatures and surface changes. Image via NASA/JPL/University of Arizona/Sci-News.com.
An erupting volcano on Io, as seen by NASA’s Galileo spacecraft in November 1997. Image via NASA/JPL/University of Arizona/NASA Science|Solar System Exploration.
The kinds of eruptions occurring now on Io are also thought to be similar to ones on Earth when it was much younger. As Ashley Davies, a volcanologist at NASA’s Jet Propulsion Laboratory said simply:
It’s a window into Earth’s past.
Loki Patera, the source of 10 percent of Io’s heat output, shows an odd pattern of brightening and dimming. The pattern was found by combining old and new data, and repeats about every 460-480 days, which is consistent with repeated variations in Io’s elliptical orbit. But the pattern isn’t always consistent. An eruption was predicted for May 2018, and it happened, but then the scientists predicted another big eruption September of this year, and it came early, in early July, ending just a few days later. As noted by Julie Rathbun, a scientist at the Planetary Science Institute:
We need to stop naming features after trickster gods!
Scientists aren’t sure yet why Loki Patera brightens and dims the way it does, but it may have something to do with a nearby lava lake that regenerates. When parts of the lava lake cool, they sink beneath the surface, possibly triggering a progressive, sweeping wave pattern seen at the surface. Wow … yes?
Another mystery is why the biggest eruptions tend to occur on the trailing hemisphere of Io, as it orbits Jupiter. Why this disparity?
Io is just slightly larger than our moon and Europa. Image via Galileo’s Pendulum.
Also, computer models predicted that Io’s volcanoes should be concentrated either near the poles or near the equator. But that’s not what is seen, and so there is an unexplained mismatch.
Scientists also still don’t know what the subsurface of Io is really like. It’s been theorized that there is an underground ocean of magma but there may actually just be pockets of magma instead, or even a fluid-filled sponge layer.
Io’s volcanic eruptions can also be very powerful, with one blast sometimes causing the moon’s brightness to double. But that itself is another mystery. Katherine de Kleer, a scientist at the California Institute of Technology, saw three of them in just two weeks in 2013, but then nothing for the next five years:
That’s weird. Where are they?
The weirdness of Io’s volcanoes is an opportunity to not only understand the Jovian moon itself better, but also volcanism on other solar system bodies, including Earth. As Alfred McEwen, a planetary geologist at the University of Arizona, noted:
The history of volcanology is that you look at ancient deposits and you’re puzzled. Then you see it erupt, and then you go, Ah-ha, now I understand.
A mosaic of images of Io’s south polar region, from Voyager 1. Image via NASA/JPL/USGS/Universe Today.
Since Io is continuously erupting, its surface is covered by sulfur lava flows new and old, giving it a very colorful and mottled appearance. That surface is no more than a couple million years old at the most at any given time, even though Io itself is about 4.5 billion years old. The moon has been described as basically turning itself inside out on an ongoing basis, thanks to Jupiter’s powerful gravity tugging at its insides. The lava flows can reach 3,000 degrees Fahrenheit (1650 Celsius) in temperature, although the surface temperature on average is -202 degrees F (-130 C). This is because Io has virtually no atmosphere to trap heat, much like our own moon.
Io’s volcanoes may be reminiscent of Earth’s, but they seem to “dance to their own tune” as it were, behaving in unexpected and puzzling ways. Io is a very strange and alien place.
Bottom line: Not only is Io the most volcanically active body in the solar system, its volcanoes are also some of the most unusual. This new report highlights Io’s most puzzling mysteries.
Source: Io’s Volcanic Activity from Time Domain Adaptive Optics Observations: 2013–2018
from EarthSky https://ift.tt/2Ku5akW