aads

How chronic inflammation may drive down dopamine and motivation

“If our theory is correct, then it could have a tremendous impact on treating cases of depression and other behavioral disorders that may be driven by inflammation,” says co-author Andrew Miller, an Emory professor of psychiatry.

By Carol Clark

Growing evidence shows that the brain’s dopamine system, which drives motivation, is directly affected by chronic, low-grade inflammation. A new paper proposes that this connection between dopamine, effort and the inflammatory response is an adaptive mechanism to help the body conserve energy.

Trends in Cognitive Sciences published the theoretical framework developed by scientists at Emory University. The authors also provided a computational method to experimentally test their theory.

“When your body is fighting an infection or healing a wound, your brain needs a mechanism to recalibrate your motivation to do other things so you don’t use up too much of your energy,” says corresponding author Michael Treadway, an associate professor in Emory’s Department of Psychology, who studies the relationship between motivation and mental illness. “We now have strong evidence suggesting that the immune system disrupts the dopamine system to help the brain perform this recalibration.”

The computational method will allow scientists to measure the effects of chronic inflammation on energy availability and effort-based decision-making. The method may yield insights into how chronic, low-grade inflammation contributes to motivational impairments in some cases of depression, schizophrenia and other medical disorders.

Co-author Andrew Miller, William P. Timmie Professor of Psychiatry and Behavioral Sciences in Emory’s School of Medicine and the Winship Cancer Institute, is a leader in this field and is pioneering the development of immunotherapeutic strategies for the treatment of psychiatric disorders.

“If our theory is correct, then it could have a tremendous impact on treating cases of depression and other behavioral disorders that may be driven by inflammation,” Miller says. “It would open up opportunities for the development of therapies that target energy utilization by immune cells, which would be something completely new in our field.”

Co-author Jessica Cooper, a post-doctoral fellow in Treadway’s lab, led the development of the computational model.

It has previously been shown that inflammatory cytokines — signaling molecules used by the immune system — impact the mesolimbic dopamine system. And recent research has revealed more insights into how immune cells can shift their metabolic states differently from most other cells.

The researchers built on these findings to develop their theoretical framework.

An immune-system mechanism to help regulate the use of energy resources during times of acute stress was likely adaptive in our ancestral environments, rife with pathogens and predators. In modern environments, however, many people are less physically active and may have low-grade inflammation due to factors such as chronic stress, obesity, metabolic syndrome, aging and other factors. Under these conditions, the same mechanism to conserve energy for the immune system could become maladaptive, the authors theorize.

Studies by Miller and others have provided evidence of an association between an elevated immune system, reduced levels of dopamine and motivation, and some diagnoses of depression, schizophrenia and other mental disorders.

“We’re not proposing that inflammation causes these disorders,” Treadway says. “The idea is that a subset of people with these disorders may have a particular sensitivity to the effects of the immune system and this sensitivity could contribute to the motivational impairments they are experiencing.”

The researchers are now using their computational method to test their theory in a clinical trial on depression.

The work for the current paper was supported by the National Institute of Mental Health.

Related:
Study reveals how the brain decides to make an effort

from eScienceCommons http://bit.ly/2JYmxNd

Mud ball meteorites rain down in Costa Rica

Lake Baikal: Earth’s deepest, oldest lake

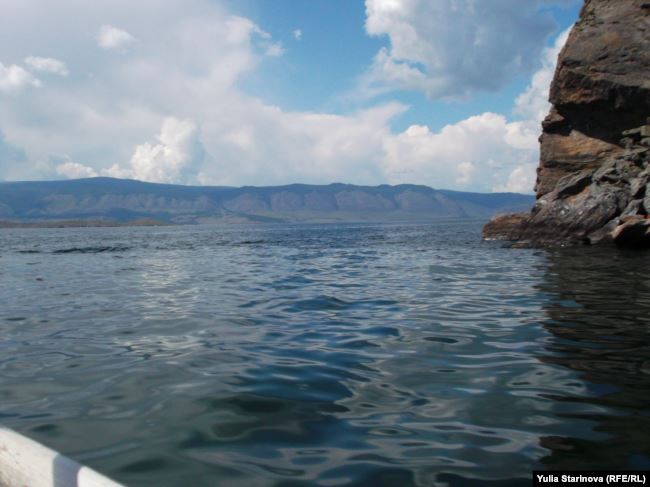
Lake water with gentle waves, low hills in background, under blue sky with white clouds.

Russia’s Lake Baikal – in southern Siberia – the world’s oldest and deepest lake. Image via Yulia Starinova/RadioFreeEurope-RadioLiberty.

Around 25 million years ago, a fissure opened in the Eurasian continent and gave birth Lake Baikal, now the oldest lake in the world. It’s the world’s deepest lake, an estimated 5,387 feet deep (1,642 meters). Among freshwater lakes, it’s the largest in terms of volume, containing about 5,521 cubic miles of water (23,013 cubic kilometers), or approximately 20% of Earth’s fresh surface water. And – like many natural waterways on Earth today – Lake Baikal is the focus of ongoing controversies over development.

This ancient and deep lake is located near the Russian city of Irkutsk, one of the largest cities in Siberia with a little over half a million population according to a 2010 census. In the 1950s, the dam that made possible the Irkutsk Hydroelectric Power Station raised the water level in Lake Baikal by over a meter (several feet). This dam and its power station were heralded as:

… a Siberian miracle, a pearl of the Soviet water-power engineering.

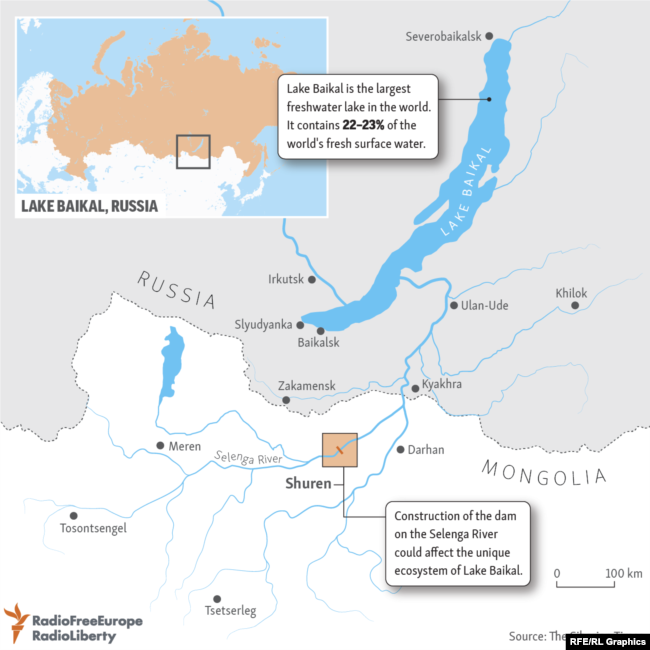
Today, however, there’s more proposed development around Lake Baikal that’s not so universally admired. Environmental activists perceive various threats to the lake – for example, invasive algae along its coastlines – but the biggest perceived threat appears to be from Mongolian power companies that, with help from the World Bank, have been looking to build more hydroelectric dams near Lake Baikal. An April 2019 article at the website Rivers without Boundaries explained:

The Shuren Hydropower Plant, planned on the Selenga River in northern Mongolia, was first proposed in 2013 and is currently the subject of a World Bank-funded environmental and social impact assessment. In tandem, Mongolia is also considering building one of the world’s largest pipelines to transport water from the Orkhon River, one of the Selenga’s tributaries, to supply the miners in the Gobi desert 1,000 km (620 miles) away.

The ongoing environmental and social impact assessment began in 2017 and was expected to take three years, so there’s been something of a hiatus for those worried about Lake Baikal. But it’s a short hiatus, and a big worry. As RadioFreeEurope-RadioLiberty explained in 2017, as the new assessment was beginning:

… Mongolia’s project is far from dead. The Mongolian government has adopted the strategic goal of attaining energy independence from Russia, from which the country currently imports much of its electricity. In addition, China – eager to gain access to Mongolian coal – has pledged $1 billion in loans for the project. In fact, construction of power lines has already begun.

Why are environmentalists so worried about Lake Baikal?

The Selenga River, where the new power plant would be located, is a 600-mile river (nearly 1,000 km) that flows into Lake Baikal. It accounts for some 80 percent of the lake’s incoming water.

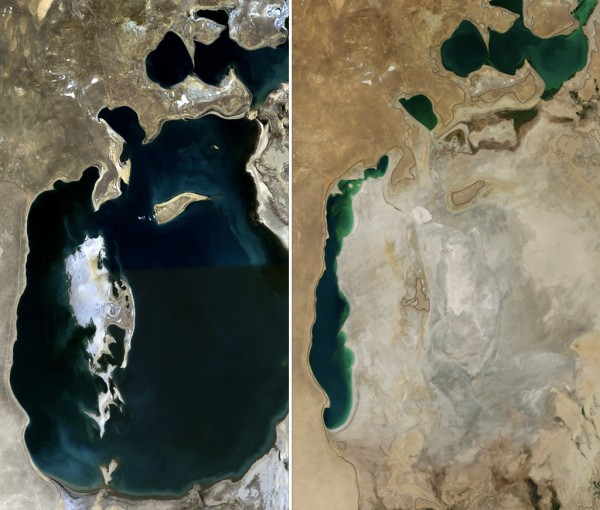
A strongly worded Siberian Times article published on May 25, 2016 spoke of an earlier ecological assessment of Lake Baikal. That assessment led to dire warnings that this lake could suffer the same fate as the Aral Sea, formerly one of the four largest lakes in the world, which began shrinking in the 1960s after the rivers that fed it were diverted by Soviet irrigation projects. By the late 1990s, the Aral Sea was less than 10 percent of its original size. According to the Siberian Times article:

Construction of … hydro power stations on the Selenga River and its tributaries can cause the unique lake [Baikal] to dry out. The 25 million-year-old lake is on the edge of environmental catastrophe and if certain measures are not taken, it might disappear just like the Aral Sea.

It’s hard to imagine the world’s deepest and largest lake disappearing due to human influence. Then again, it’s not hard to imagine a damaging environmental effect on a once-pristine natural area.

Large oval Aral Sea on left, tiny strip remaining on right.

The Aral Sea in 1989 (l) and 2014 (r). Image via Wikimedia Commons.

Lake Baikal is currently a natural reservoir and a UNESCO world heritage site. It contains around 20 percent of the world’s unfrozen freshwater. In total, some 330 rivers and streams flow into Lake Baikal, some large like the Selenga and many small. Its main outflow is the Angara River. The water in the lake is said to be crystal clear, and some claim it has magical, mystical power. Those who want to preserve it point out that it is:

… the ‘Galapagos of Russia’ … its age and isolation have produced one of the world’s richest and most unusual freshwater faunas, which is of exceptional value to evolutionary science.

Holding one-fifth of Earth’s unfrozen fresh water, Lake Baikal is unlike other deep lakes in that it contains dissolved oxygen right down to the lake floor. That means creatures thrive at all depths in the lake. Most of Lake Baikal’s 2,500-plus species of plants and animals are found nowhere else in the world. Scientists believe up to 40 percent of the lake’s species haven’t been described yet. Species endemic to Lake Baikal have evolved over tens of thousands, perhaps millions, of years.

They occupy ecological niches that were undisturbed, until the last few decades.

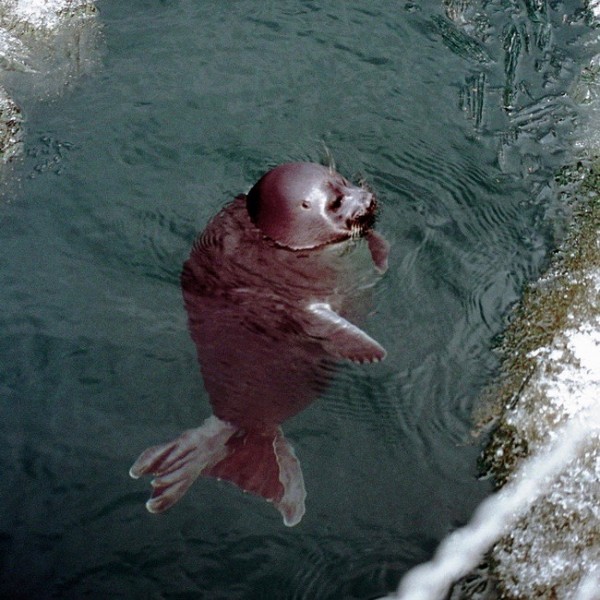
Reddish seal floating upright in water next to steep shoreline.

The large freshwater seal indigenous to Lake Baikal, called a “nerpa.” Read more about the Lake Baikal seal at AskBaikal.

Lake Baikal’s unique biodiversity includes species like the Baikal seal, also known as nerpa. It’s the only mammal indigenous to Lake Baikal. In fact, scientists aren’t sure how these seals originally got into Lake Baikal. There are two primary hypotheses concerning this question, which you can read about here.

Another famous species native to Lake Baikal is the omul, a type of whitefish. It’s part of the salmon family. Local economies around Lake Baikal depend on this fish; it’s the main product found at local fisheries. Due to overfishing, it was listed as an endangered species in 2004.

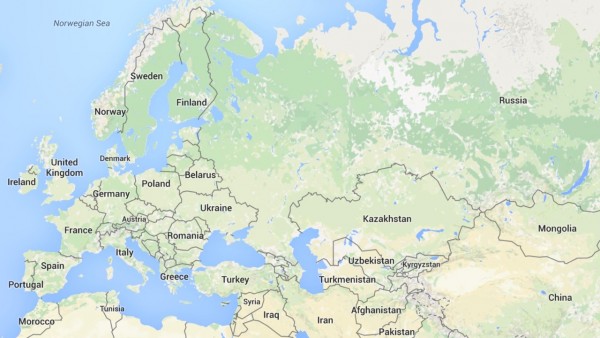
Topographic map of Europe and west Asia with borders showing location of lake.

On the far right side of this map, just above Mongolia, do you see the large blue crescent? That’s Lake Baikal. Map via Google.

By the way, even as humans vie for the opportunity to utilize the waterways around Lake Baikal – or protect them – over the long course of time, Mother Nature will also have its effect on the lake. The website Geology.com pointed out:

Lake Baikal is so deep because it is located in an active continental rift zone. The rift zone is widening at a rate of about 1 inch (2.5 cm) per year. As the rift grows wider, it also grows deeper through subsidence. So, Lake Baikal could grow wider and deeper in the future.

And so the saga of Lake Baikal continues …

Read more: Lake Baikal versus dams and pipelines, from Rivers without Boundaries.

Read more: Lake Baikal’s World Heritage Data Sheet

Read more: Rare animals of Lake Baikal

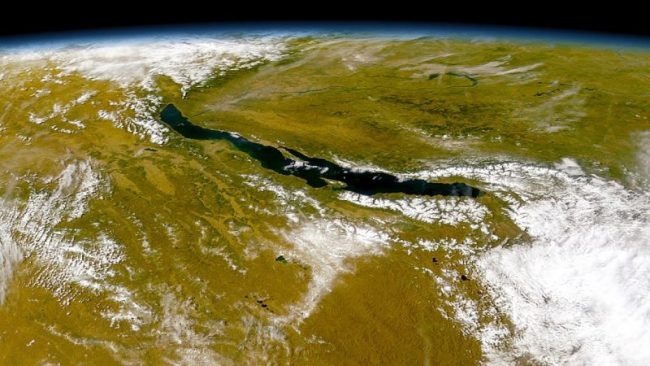
Orbital view of Earth with long, dark streak down middle of green surface, black sky in background.

Lake Baikal seen from space. Image via the SeaWiFS Project, NASA/Goddard Space Flight Center, and ORBIMAGE.

Sparkly lake water going into distance with faraway mountains.

Lake Baikal, via Flickr user Kyle Taylor.

Bottom line: Ancient and deep Lake Baikal is a a UNESCO world heritage site. Controversy surrounds construction of hydropower stations on a river that feeds the lake.


from EarthSky http://bit.ly/2JU20JD

View from space: North America’s deepest lake

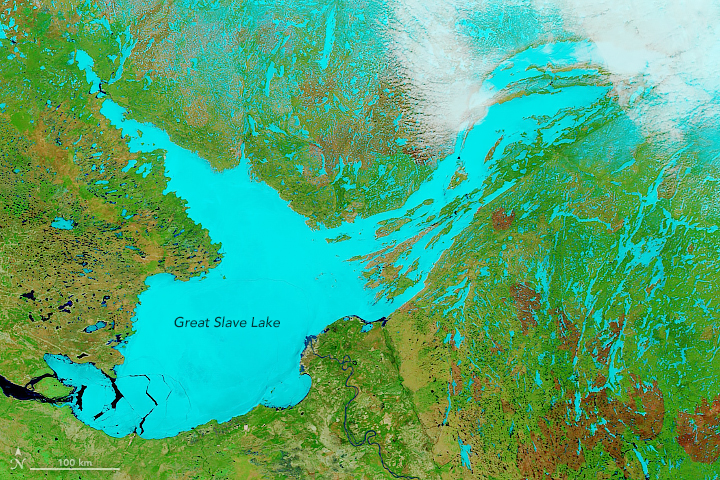
View from space of irregular, ice-covered Great Slave Lake against mostly brownish surface.

Great Slave Lake, May 16, 2019, via NASA Earth Observatory. This image was acquired by the Moderate Resolution Imaging Spectroradiometer (MODIS) on NASA’s Terra satellite.

Reprinted from NASA Earth Observatory. Images by Kasha Patel, using MODIS data from NASA EOSDIS/LANCE and GIBS/Worldview. Story by Kasha Patel.

If you are traveling on Canada’s Great Slave Lake, you will notice one characteristic right away: it is enormous. Roughly the size of Belgium, it ranks in the top 15 largest lakes worldwide. It is the deepest lake in North America, diving about 615 meters (2,020 feet), almost the same extent as the height of the world’s second tallest building, the Shanghai Tower.

Great Slave Lake is a lifeline to the surrounding shoreline communities. It’s home to more than half of the population of the Northwest Territories, including its capital Yellowknife. Many of these communities depend on the lake for its abundance of fish, which helps drive the fishing and tourism industry. More than 5,000 anglers visit the area annually to catch fish, which keep near the lake’s surface in the summer.

The image above shows the breadth of Great Slave Lake, still mostly covered in ice, on May 16, 2019. The lake stretches about 500 kilometers (300 miles) long and from 50 to 225 kilometers (30 to 140 miles) wide. It is a major source of water for Canada’s longest river, the Mackenzie, which connects at the southwest end of the lake. This image was acquired by the Moderate Resolution Imaging Spectroradiometer (MODIS) on NASA’s Terra satellite.

Getting across or around the lake can be a challenge, but people can travel on an all-season highway on the west side of the lake. In the wintertime, some portions of the lake freeze over with ice thick enough to drive on. Generally, the lake is frozen for eight months, from late November to mid May.

Same image as above, but the lake is aqua against a green background.

Great Slave Lake in false color, May 16, 2019 via NASA Earth Observatory.

The second image shows the same scene in false color (MODIS bands 7-2-1), which helps differentiate areas of ice (light blue) from water (dark blue). The lake and surrounding areas have thawed a considerable amount since April.

In 2019, ice on the lake melted faster than in previous years. For the first time in 24 years, the Snowking’s Winter Festival had to close its annual Snowcastle on the lake due to warm temperatures threatening the ice structure. The ice road from Yellowknife to Dettah also closed about a week earlier than in typical years. News outlets report that low water levels in the lake also contributed to the ice breaking up earlier than usual.

Bottom line: Roughly the same size of Belgium, Canada’s Great Slave Lake runs nearly 2,000 feet (600 meters) deep. This article from NASA Earth Observatory describes the lake and conditions around it in 2019.


from EarthSky http://bit.ly/2MsBysv

Young moon, Mercury, Mars on June 4 to 6

Start looking for the young moon in the evening sky around June 4, 2019. Will anyone see it on June 3? Possibly, but by June 4 we should all be able to see it, near the sunset point, shortly after sunset. Elusive Mercury, innermost planet in our solar system, is also in that part of the sky. Red Mars – now rather faint – shines above Mercury. Mercury can be found near the moon on June 4; then on June 5 and 6, the moon’s lighted face points to Mars. Just note that Mars is far behind Earth now in the race of the planets around the sun. Earth will soon “turn the corner” ahead of Mars in orbit, sending the planet into the sunset glare. Mars is so faint now that it might not be visible until nightfall, after the moon and Mercury have already set. In other words, have your binoculars handy.

Mercury, on the other hand, is brighter than Mars now, although it might not look brighter to you this week because it’s still near the sunset. In both the Northern and Southern Hemispheres, June 2019 presents a fine apparition of Mercury in the evening sky. On these early June evenings, Mercury is some 5 times brighter than a 1st-magnitude star and 10 times brighter than Mars. Even though this planet has to contend the afterglow of sunset, you might be able to see Mercury with the eye alone an hour or so after sunset. If not … yep, you guessed it. Try your binoculars.

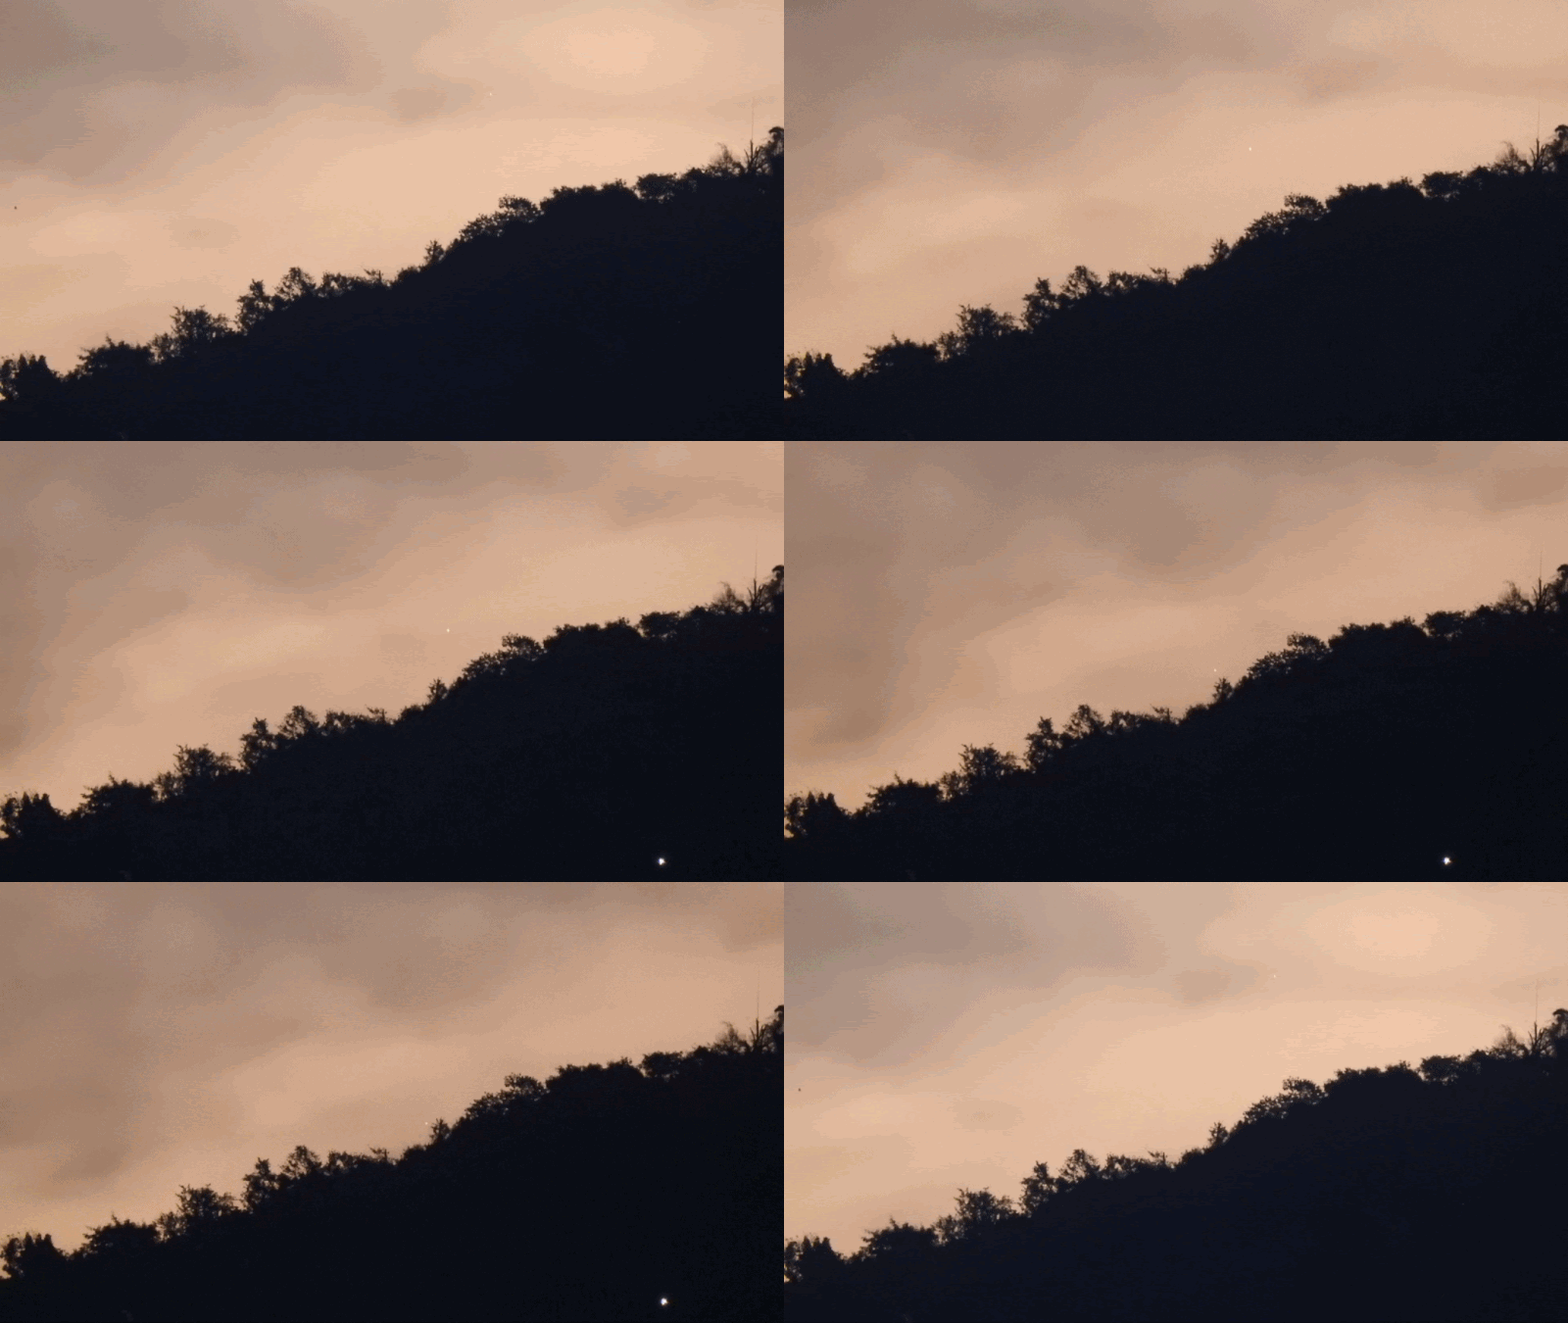
Animated images of Mercury, descending in a cloudy sky.

View at EarthSky Community Photos. | Our friend Helio de Carvalho Vital in Rio de Janeiro, Brazil images of caught Mercury on May 31, 2019, to make this time-lapse movie. He wrote: “The photo shows elusive Mercury, shining at magnitude -1.2, 24 minutes after sunset. It was a mere 3 degrees above Rio`s horizon, while the sun was 6 degrees below … The western sky was mostly clouded, but fortunately a narrow gap in the clouds that lasted about 2 minutes allowed me to get some images.” Thanks, Helio!

Be forewarned. On June 4, the moon is a thin and pale lunar crescent that pops out rather low in the western sky (along with Mercury) at evening dusk. Both the June 4 moon and Mercury will follow the sun beneath the horizon before it gets good and dark. Depending on where you live worldwide, the June 4 moon might – or might not – stay out as late as nightfall. No matter where you live worldwide, your best bet for catching the moon and Mercury is to find an unobstructed horizon in the direction of sunset. Also, on this evening, watch for earthshine softly illuminating the darkened portion of the moon.

If you miss seeing the waxing crescent moon after sunset on June 4, try again on the evenings of June 5 and 6 (when the moon will be higher up and closer to Mars). Day by day, a wider and brighter lunar crescent will will stay out longer after dark. By June 6, the moon will be near the two brightest stars in the constellation Gemini the Twins. These stars are noticeable for being bright and close together in our sky.

Read more: Pollux is the brighter Twin star

Read more: Castor is 6 stars in one

Read more: Gemini, here’s your constellation

Although Mercury will dim throughout the month, it’ll make up for its diminishing brightness by staying out longer after sunset. From most places worldwide, Mercury stays out an hour or so after sunset in early June. By the middle of June, Mercury will stay out for 100 minutes or longer after sundown.

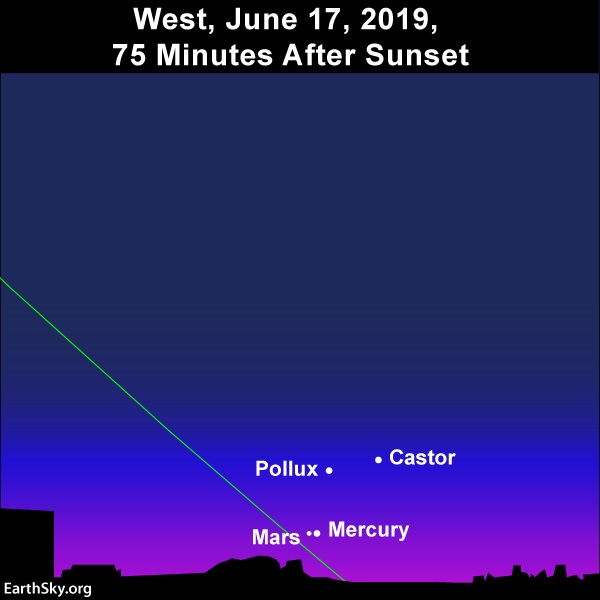
Day by day, Mercury will climb upward, away from the glare of sunset, until this inner world reaches its highest point in the evening sky on June 23, 2019. Meanwhile, Mars will be falling downward, sinking closer and closer to the setting sun. So watch for Mercury and Mars to snuggle up quite close together in the evening sky on June 17, 18 and 19, with Mercury passing a scant 0.2 degrees north of Mars on June 18, to stage the closest conjunction of two planets in 2019. (For reference, 0.2 or 1/5th degree spans less than a pencil width an arm length). Starting around June 11, Mercury and Mars should be close enough together on the sky’s dome to take stage within a single binocular field.

Mercury and Mars on June 17, 2018.

As seen from North America, Mercury and Mars will stand side by side after sunset June 17, 2019.

Bottom line: These next several days – on June 4, 5 and 6, 2019 – use the young moon to find the planets Mercury and Mars, and then watch for Mercury to pair up most closely together on June 17 or 18, 2019.

Click here to know when the moon sets in your sky, remembering to check the moonrise and moonset box

Click here to find out when Mercury and Mars set in your sky, remembering to choose Mercury or Mars as your celestial object of interest.


from EarthSky http://bit.ly/2WiTtXj

Effects of Global Warming

Why are young – and not so young – people becoming more vociferous in their protests about global warming?  Why has climate change become a political and partisan issue at democratic elections?  Why do ‘greenies’ try to stop the development of new coal mines and call for speedier reduction of our greenhouse gas emissions?  The answer is that the effects of greenhouse gas emissions, particularly Carbon Dioxide (CO2), are becoming increasingly evident and dangerous – although relatively mild at present, compared to what they could soon become.

Much is being said about the cost of reducing greenhouse gas emissions in terms of lost jobs, lost income and harm to national and global economies but we hear relatively little about the catastrophic consequences of not reducing emissions.  Prioritising short term profit and ideology ahead of emissions reduction will inevitably result in an uncontrollable, unpredictable and destructive climate resulting in socio-economic collapse.
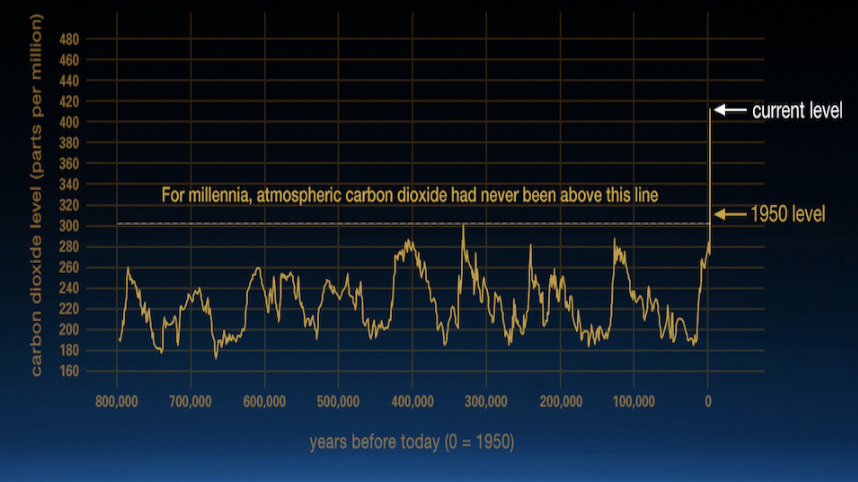
 

 Fig. 1.  Fluctuations in the level of COin the atmosphere, relatively regular until burning of fossil fuels began about 200 years ago. Note the ‘spike’ on the right at year ‘0’   Source: Nasa.

Analysis of air trapped in ice cores shows that over the past 800,000 years the normal concentration of CO2 in the atmosphere varies between 170 parts per million (ppm) during cold periods (so called Ice Ages) to 260-300 ppm when the planet reaches its warmest.  Concentration of COin the atmosphere now stands at over 415 ppm and is continuing to rise at an accelerating rate as we burn ever increasing amounts of fossil fuels.

For well over a century it has been widely known that COabsorbs infra-red light reflected from the earths’ surface then re-emits it, much of it back to the surface.  The higher the concentration of COin the atmosphere, the warmer the surface temperature gets, a phenomenon known as global warming which has a number of effects including 1. ocean warming, 2. loss of land-based ice and permafrost, 3. climate change which becomes less predictable and 4. sea level rise.  Below is an outline of these effects.

1. Ocean Warming

Most of the additional heat generated by rising levels of COin the atmosphere is absorbed by the oceans.  As a result, sea surface temperature is rising and already causing:

Thermal Expansion:  As its temperature increases, seawater expands, contributing to sea level rise, changes in ocean circulation and higher seabed water temperature which may be damaging and pose the dangers described below:

Coastal Erosion:  Rise in sea level, combined with other factors such as stronger wind events and loss of natural barriers protecting the coastline, result in increased coastal erosion endangering infrastructure, buildings and other facilities located in close proximity to the coastline.

Arctic Erosion:  The Arctic ocean is warming, resulting in stronger storm activity and reduced sea ice formation, both contributing to erosion of coastlines hitherto kept stable by permafrost and sea ice reducing wave action.  This causes increased exposure and thawing of methane (CH4) bearing sediments and yedoma resulting in emission of this gas and its oxidation to CO2, contributing to its rising presence in the atmosphere and further global warming.

Warmer bottom water: This is accelerating melting of ice enabling faster flow from glaciers discharging to the oceans and erosion of the marine ice sheet covering the West Antarctic archipelago – both causing sea level rise to accelerate and reducing stability of the ice sheet.

Warming seawater, particularly where shallow such as that covering the East Siberian Arctic Shelf, causes thawing of permafrost sediments containing CH4, which is being released directly to the atmosphere, contributing to accelerated global warming. 
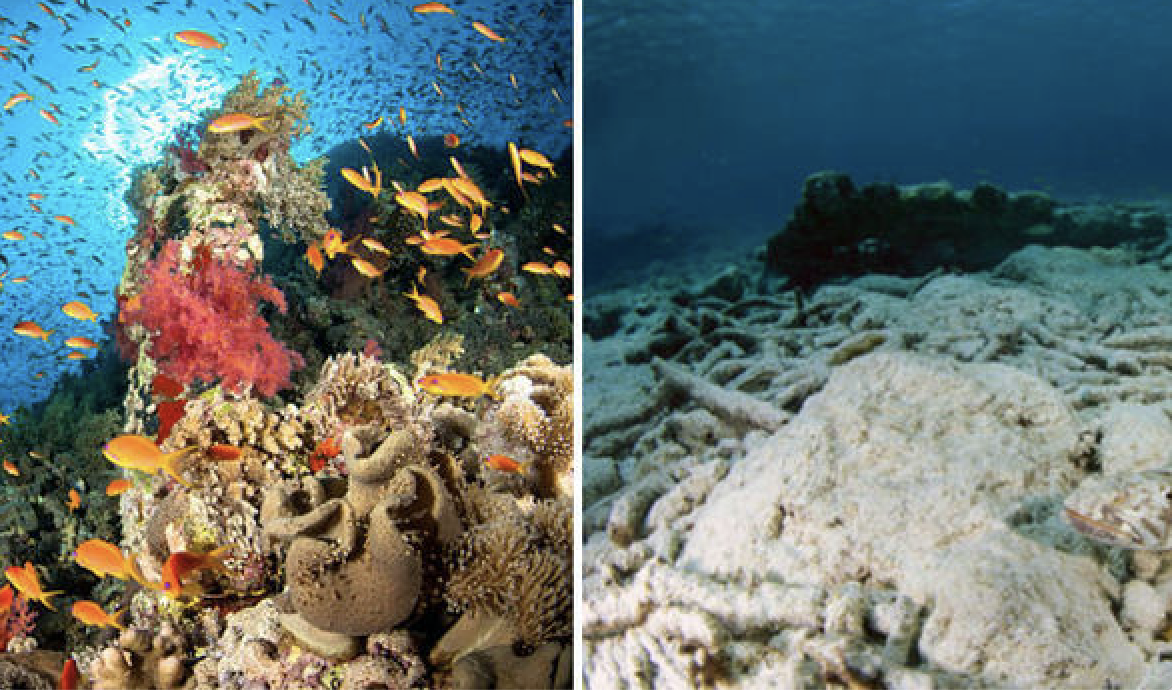
 Fig 2.  Before and After.  When corals are stressed by temperature they eject algae from their tissues, which give them their colour and die, losing the numerous varieties of fish which depend on them.  Source: Environments in Danger.

Coral Die-off:  Reefs comprise a great variety of corals often growing in relatively shallow water.  Coral reefs are weakened by human pollution making them susceptible to predation but are severely stressed or killed en masse by seawater temperature rising by 2C or more for 6-10 weeks or longer.  Their loss exposes adjacent coastlines, often low-lying, to erosion and flooding, destroys fish habitat and reduces fish catch for human consumption. 

2.Ice Loss

Mountain glaciers store water which flows into rivers on which human populations depend for potable water, irrigation, food production, transport and generating energy, often in areas of dense population.  These glaciers are storing less water and melting more rapidly so that in the future sufficient water may not be available for an expanding human population and its increasing demand for food and potable water.

Permafrost:  Vast areas of land in the Arctic contain partly decomposed biota, sediments containing CHproduced from biota decomposition and yedoma. These lands are permanently frozen but global warming produces surface temperatures which result in it melting more rapidly and to greater depth.  As it melts, it exposes biota which thaws, resuming decomposition and producing CHmuch of which is converted to COthrough oxidation by methantrophic bacteria, then emitted to the atmosphere.

As permafrost melts the land subsides and becomes covered, in shallow water creating anoxic conditions in which methanotrophs are not active and this results in CHfrom decaying biota and thawing yedoma being released to the atmosphere.  CHand COemitted from permafrost land thawing accelerate global warming.  These emissions are already occurring and can not be safely controlled by human intervention.

Land Subsidence:  Buildings and infrastructure built on permanently frozen land, particularly in Russia and Alaska, is put at risk when warming surface temperature causes permafrost to thaw and the land to subside.  At risk are transport infrastructure, electricity supply, water and sewage mains, oil and gas pipelines and buildings and bridges – even entire cities.  Land subsidence is likely to cause damage to the environment – eg. spills from ruptured pipelines.  It may prove so costly to repair damage caused by subsidence as to force asset abandonment. 
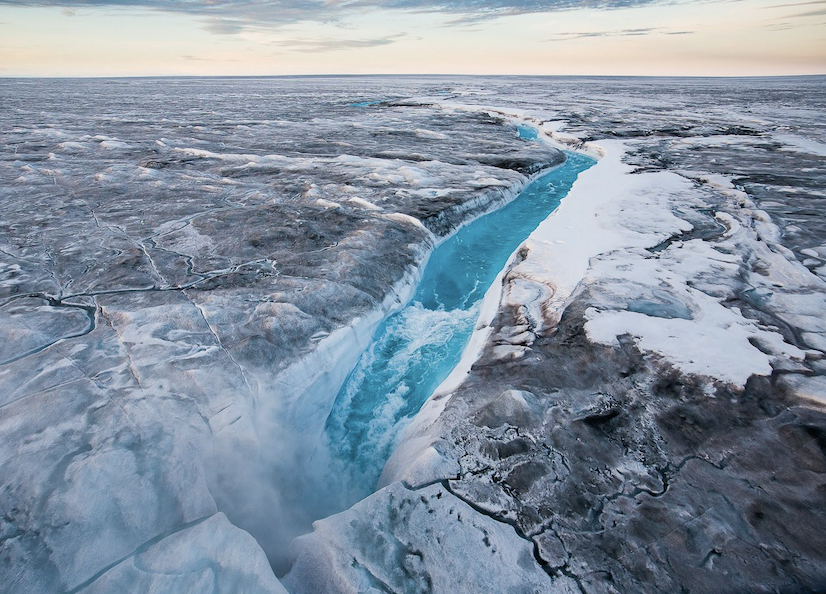
 

 Fig. 3.  River flowing on surface of Greenland Ice Sheet into a moulin reaching the ice sheet base.  Note discolouration of ice due to aerosol deposits of soot originating from forest and tundra fires, reducing albedo and causing faster ice melt.  Credit:  Adam Scott Images.

Polar Ice Sheets:  Global warming causes the surface of the Greenland Ice Sheet to melt more rapidly, resulting in rivers flowing on its surface, terminating in moulins through which they drain to bedrock.  This intensely cold water lubricates the underside of the ice-sheet making it more mobile, before draining into the North Atlantic where it contributes to disruption of overturning circulation and flow of the Gulf Stream.

Ice Melt:  Disruption of overturning circulation traps warmer water on the seabed causing the West Antarctic marine ice sheet to melt at its base, contributing to its instability.  Warm seawater penetrates polar glaciers eroding ice blockages, enabling glaciers to discharge ice at faster rates resulting in ice sheets becoming less stable, as evidenced in Greenland and West Antarctica.  This contributes to faster sea level rise which increases the risk of coastal erosion and flooding.

3. Climate Change

The temperature of the troposphere is now slightly under 1°C above the pre-industrial and is continuing to rise due to increasing emission of greenhouse gasses.  This warming is characterised by less predictable, increasingly severe weather events, which include the following:

Temperatures:  temperature extremes are setting new record highs and fewer days of extreme cold, though these do occur in the northern hemisphere due to distortion of the polar vortex.

Droughts:  affecting farmland and habitat are becoming longer lasting – in many cases lasting over 5 years and reducing river flows.

Evaporation:  Increased evaporation of water from soil and lakes occurs because the troposphere is getting warmer and able to hold more water in the form of vapour.

Wind Events such as cyclones and tornados may be less frequent but are more powerful and destructive, their strength increased by rising sea surface temperature.

Rainfall:  In some areas rainfall has become less frequent but heavier and of longer duration, while hail storms have become more severe, often with larger hail stones.

On-going global warming will cause these events to become more frequent, last longer and become more severe.  Alone or in combination they will continue to cause increasing damage to the environment in the following ways:

Rising temperatures are the principal cause of coral reefs dying, the loss of fish habitat and the protection they provide to low-lying coastal land from erosion by ocean wave action, making them vulnerable to flooding.  On-shore temperature extremes are already setting new record highs resulting in declining food production and premature deaths.

Droughts and evaporation of surface water produce similar effects, converting some food bowls to dust bowls, increasing the rate of desertification and killing flora and fauna. Droughts in some parts of Australia have lasted over 8 years, causing rivers to run dry, preventing crop sowing, forcing destocking and overland transport of water to enable survival of town populations. 
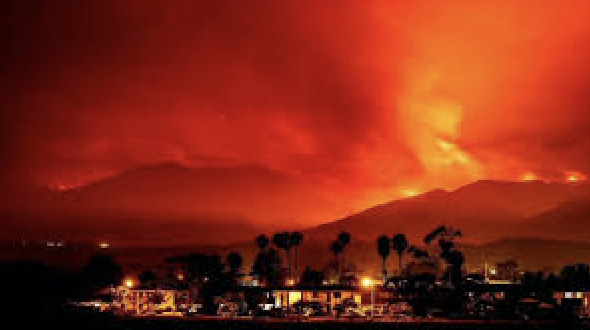
Fig. 4.  Wildfires are becoming larger, more difficult to control or uncontrollable.  Damage and destruction of property by wildfires is increasingly expensive with insured losses of 2018 California fires estimated to exceed $10 billion.

Combined, these events result in ferocious bushfires which are increasingly difficult to control, causing huge losses of trees, vegetation, fauna and property – including livestock – all becoming more and more costly to replace, more often forcing abandonment.  They also enable pathogens and pests such as mountain pine beetles to invade and kill millions of trees and the spread of vectors carrying human diseases into areas hitherto free of them.

Wind events, often accompanied by heavy rainfall, are becoming more frequent and often result in flooding, loss of human life, damage to property, the environment and crop losses.  They produce tidal surges which erode coastlines and flood low lying land.

4. Sea Level Rise

We know that thermal expansion caused by ocean warming and loss of mass from ice sheets and glaciers are the primary causes of sea level rise.  Less certain is the speed with which these causes take effect. 

Many climate scientists specialising in this area, notably those contributing to IPCC Assessment Reports, are of the view that these are relatively slow processes indicating sea level rise of 0.52-0.98 metres by 2100. Others, including leading specialists in this field, point to evidence showing more rapid loss of ice, producing much faster, multi-metre sea level riseover the same period because of accelerating loss of mass from both the West Antarctic and Greenland ice caps, primarily as a result of increased glacier discharge rates.

Many of the worlds’ cities are located on low coastal land which is very vulnerable to a multi-metre rise in sea level.  Australia’s Gold Coast with hundreds of kilometres of canals connected to the sea, Miami in Florida, even mega cities such as Shanghai would sustain heavy damage from sea level rise.  Island nations such as Kiribati and the Maldives would be flooded, forcing abandonment.  A rise of at least 2 metres is now thought possible by 2100.

World-wide the value of coastal property is likely plummet by hundreds of millions of dollars since there is no protection from rising seas or the increasingly severe storms which they will produce.  Several hundred million people may have to retreat from coastal areas threatened by rising sea level this century.

Conclusions

For more than fifty years, climate scientists have warned that continued emission of greenhouse gasses into the atmosphere, particularly CO2, would result in climate change and if average global temperature rises by more than 1.5°C. above pre-industrial levels, those changes would be dangerous.  If average global temperature rises by more than 2°C climate changes could become catastrophic, threatening most life on the planet.  If we continue to ignore these warnings, we do so at our peril. In practice we have ignored them.

There is only one way of averting the outcomes described above and that is by stopping all use of fossil fuels over the next 10-20 years, improving the ability of natural carbon sinks and new technology to absorb COfrom the atmosphere.  Transition to a decarbonised economy can be achieved within this time frame and, in the process, renewable energy required by the human population could become unlimited in its availability, rather than a constraint on innovation.

There is a price to pay for achieving this.  The price is to reduce demand for fossil fuels to meet our energy needs and replace them with renewable energy.  Reduction in demand for fossil fuels will result in shut-down of oil fields and refineries, closure of coal mines and stopping production and use of gas over the next 20 years.  We have long known the inevitability of these outcomes and the need to ensure they are achieved in a planned, orderly way, involving retraining and re-employment of those currently engaged in them.

Too higher price to pay?  Not when compared with the alternative which is to resist change and, in the interests of maximising profit, continue to move far too slowly to avert increasingly dangerous outcomes.  Young people rightly protest against this and those responsible for killing flora and fauna (which includes humans), destroying their habitat and giving impetus to the 6thmass extinction now in progress.


from Skeptical Science http://bit.ly/2WJDEYZ

Why are young – and not so young – people becoming more vociferous in their protests about global warming?  Why has climate change become a political and partisan issue at democratic elections?  Why do ‘greenies’ try to stop the development of new coal mines and call for speedier reduction of our greenhouse gas emissions?  The answer is that the effects of greenhouse gas emissions, particularly Carbon Dioxide (CO2), are becoming increasingly evident and dangerous – although relatively mild at present, compared to what they could soon become.

Much is being said about the cost of reducing greenhouse gas emissions in terms of lost jobs, lost income and harm to national and global economies but we hear relatively little about the catastrophic consequences of not reducing emissions.  Prioritising short term profit and ideology ahead of emissions reduction will inevitably result in an uncontrollable, unpredictable and destructive climate resulting in socio-economic collapse.


 Fig. 1.  Fluctuations in the level of COin the atmosphere, relatively regular until burning of fossil fuels began about 200 years ago. Note the ‘spike’ on the right at year ‘0’   Source: Nasa.

Analysis of air trapped in ice cores shows that over the past 800,000 years the normal concentration of CO2 in the atmosphere varies between 170 parts per million (ppm) during cold periods (so called Ice Ages) to 260-300 ppm when the planet reaches its warmest.  Concentration of COin the atmosphere now stands at over 415 ppm and is continuing to rise at an accelerating rate as we burn ever increasing amounts of fossil fuels.

For well over a century it has been widely known that COabsorbs infra-red light reflected from the earths’ surface then re-emits it, much of it back to the surface.  The higher the concentration of COin the atmosphere, the warmer the surface temperature gets, a phenomenon known as global warming which has a number of effects including 1. ocean warming, 2. loss of land-based ice and permafrost, 3. climate change which becomes less predictable and 4. sea level rise.  Below is an outline of these effects.

1. Ocean Warming

Most of the additional heat generated by rising levels of COin the atmosphere is absorbed by the oceans.  As a result, sea surface temperature is rising and already causing:

Thermal Expansion:  As its temperature increases, seawater expands, contributing to sea level rise, changes in ocean circulation and higher seabed water temperature which may be damaging and pose the dangers described below:

Coastal Erosion:  Rise in sea level, combined with other factors such as stronger wind events and loss of natural barriers protecting the coastline, result in increased coastal erosion endangering infrastructure, buildings and other facilities located in close proximity to the coastline.

Arctic Erosion:  The Arctic ocean is warming, resulting in stronger storm activity and reduced sea ice formation, both contributing to erosion of coastlines hitherto kept stable by permafrost and sea ice reducing wave action.  This causes increased exposure and thawing of methane (CH4) bearing sediments and yedoma resulting in emission of this gas and its oxidation to CO2, contributing to its rising presence in the atmosphere and further global warming.

Warmer bottom water: This is accelerating melting of ice enabling faster flow from glaciers discharging to the oceans and erosion of the marine ice sheet covering the West Antarctic archipelago – both causing sea level rise to accelerate and reducing stability of the ice sheet.

Warming seawater, particularly where shallow such as that covering the East Siberian Arctic Shelf, causes thawing of permafrost sediments containing CH4, which is being released directly to the atmosphere, contributing to accelerated global warming. 

 Fig 2.  Before and After.  When corals are stressed by temperature they eject algae from their tissues, which give them their colour and die, losing the numerous varieties of fish which depend on them.  Source: Environments in Danger.

Coral Die-off:  Reefs comprise a great variety of corals often growing in relatively shallow water.  Coral reefs are weakened by human pollution making them susceptible to predation but are severely stressed or killed en masse by seawater temperature rising by 2C or more for 6-10 weeks or longer.  Their loss exposes adjacent coastlines, often low-lying, to erosion and flooding, destroys fish habitat and reduces fish catch for human consumption. 

2.Ice Loss

Mountain glaciers store water which flows into rivers on which human populations depend for potable water, irrigation, food production, transport and generating energy, often in areas of dense population.  These glaciers are storing less water and melting more rapidly so that in the future sufficient water may not be available for an expanding human population and its increasing demand for food and potable water.

Permafrost:  Vast areas of land in the Arctic contain partly decomposed biota, sediments containing CHproduced from biota decomposition and yedoma. These lands are permanently frozen but global warming produces surface temperatures which result in it melting more rapidly and to greater depth.  As it melts, it exposes biota which thaws, resuming decomposition and producing CHmuch of which is converted to COthrough oxidation by methantrophic bacteria, then emitted to the atmosphere.

As permafrost melts the land subsides and becomes covered, in shallow water creating anoxic conditions in which methanotrophs are not active and this results in CHfrom decaying biota and thawing yedoma being released to the atmosphere.  CHand COemitted from permafrost land thawing accelerate global warming.  These emissions are already occurring and can not be safely controlled by human intervention.

Land Subsidence:  Buildings and infrastructure built on permanently frozen land, particularly in Russia and Alaska, is put at risk when warming surface temperature causes permafrost to thaw and the land to subside.  At risk are transport infrastructure, electricity supply, water and sewage mains, oil and gas pipelines and buildings and bridges – even entire cities.  Land subsidence is likely to cause damage to the environment – eg. spills from ruptured pipelines.  It may prove so costly to repair damage caused by subsidence as to force asset abandonment. 


 Fig. 3.  River flowing on surface of Greenland Ice Sheet into a moulin reaching the ice sheet base.  Note discolouration of ice due to aerosol deposits of soot originating from forest and tundra fires, reducing albedo and causing faster ice melt.  Credit:  Adam Scott Images.

Polar Ice Sheets:  Global warming causes the surface of the Greenland Ice Sheet to melt more rapidly, resulting in rivers flowing on its surface, terminating in moulins through which they drain to bedrock.  This intensely cold water lubricates the underside of the ice-sheet making it more mobile, before draining into the North Atlantic where it contributes to disruption of overturning circulation and flow of the Gulf Stream.

Ice Melt:  Disruption of overturning circulation traps warmer water on the seabed causing the West Antarctic marine ice sheet to melt at its base, contributing to its instability.  Warm seawater penetrates polar glaciers eroding ice blockages, enabling glaciers to discharge ice at faster rates resulting in ice sheets becoming less stable, as evidenced in Greenland and West Antarctica.  This contributes to faster sea level rise which increases the risk of coastal erosion and flooding.

3. Climate Change

The temperature of the troposphere is now slightly under 1°C above the pre-industrial and is continuing to rise due to increasing emission of greenhouse gasses.  This warming is characterised by less predictable, increasingly severe weather events, which include the following:

Temperatures:  temperature extremes are setting new record highs and fewer days of extreme cold, though these do occur in the northern hemisphere due to distortion of the polar vortex.

Droughts:  affecting farmland and habitat are becoming longer lasting – in many cases lasting over 5 years and reducing river flows.

Evaporation:  Increased evaporation of water from soil and lakes occurs because the troposphere is getting warmer and able to hold more water in the form of vapour.

Wind Events such as cyclones and tornados may be less frequent but are more powerful and destructive, their strength increased by rising sea surface temperature.

Rainfall:  In some areas rainfall has become less frequent but heavier and of longer duration, while hail storms have become more severe, often with larger hail stones.

On-going global warming will cause these events to become more frequent, last longer and become more severe.  Alone or in combination they will continue to cause increasing damage to the environment in the following ways:

Rising temperatures are the principal cause of coral reefs dying, the loss of fish habitat and the protection they provide to low-lying coastal land from erosion by ocean wave action, making them vulnerable to flooding.  On-shore temperature extremes are already setting new record highs resulting in declining food production and premature deaths.

Droughts and evaporation of surface water produce similar effects, converting some food bowls to dust bowls, increasing the rate of desertification and killing flora and fauna. Droughts in some parts of Australia have lasted over 8 years, causing rivers to run dry, preventing crop sowing, forcing destocking and overland transport of water to enable survival of town populations. 

Fig. 4.  Wildfires are becoming larger, more difficult to control or uncontrollable.  Damage and destruction of property by wildfires is increasingly expensive with insured losses of 2018 California fires estimated to exceed $10 billion.

Combined, these events result in ferocious bushfires which are increasingly difficult to control, causing huge losses of trees, vegetation, fauna and property – including livestock – all becoming more and more costly to replace, more often forcing abandonment.  They also enable pathogens and pests such as mountain pine beetles to invade and kill millions of trees and the spread of vectors carrying human diseases into areas hitherto free of them.

Wind events, often accompanied by heavy rainfall, are becoming more frequent and often result in flooding, loss of human life, damage to property, the environment and crop losses.  They produce tidal surges which erode coastlines and flood low lying land.

4. Sea Level Rise

We know that thermal expansion caused by ocean warming and loss of mass from ice sheets and glaciers are the primary causes of sea level rise.  Less certain is the speed with which these causes take effect. 

Many climate scientists specialising in this area, notably those contributing to IPCC Assessment Reports, are of the view that these are relatively slow processes indicating sea level rise of 0.52-0.98 metres by 2100. Others, including leading specialists in this field, point to evidence showing more rapid loss of ice, producing much faster, multi-metre sea level riseover the same period because of accelerating loss of mass from both the West Antarctic and Greenland ice caps, primarily as a result of increased glacier discharge rates.

Many of the worlds’ cities are located on low coastal land which is very vulnerable to a multi-metre rise in sea level.  Australia’s Gold Coast with hundreds of kilometres of canals connected to the sea, Miami in Florida, even mega cities such as Shanghai would sustain heavy damage from sea level rise.  Island nations such as Kiribati and the Maldives would be flooded, forcing abandonment.  A rise of at least 2 metres is now thought possible by 2100.

World-wide the value of coastal property is likely plummet by hundreds of millions of dollars since there is no protection from rising seas or the increasingly severe storms which they will produce.  Several hundred million people may have to retreat from coastal areas threatened by rising sea level this century.

Conclusions

For more than fifty years, climate scientists have warned that continued emission of greenhouse gasses into the atmosphere, particularly CO2, would result in climate change and if average global temperature rises by more than 1.5°C. above pre-industrial levels, those changes would be dangerous.  If average global temperature rises by more than 2°C climate changes could become catastrophic, threatening most life on the planet.  If we continue to ignore these warnings, we do so at our peril. In practice we have ignored them.

There is only one way of averting the outcomes described above and that is by stopping all use of fossil fuels over the next 10-20 years, improving the ability of natural carbon sinks and new technology to absorb COfrom the atmosphere.  Transition to a decarbonised economy can be achieved within this time frame and, in the process, renewable energy required by the human population could become unlimited in its availability, rather than a constraint on innovation.

There is a price to pay for achieving this.  The price is to reduce demand for fossil fuels to meet our energy needs and replace them with renewable energy.  Reduction in demand for fossil fuels will result in shut-down of oil fields and refineries, closure of coal mines and stopping production and use of gas over the next 20 years.  We have long known the inevitability of these outcomes and the need to ensure they are achieved in a planned, orderly way, involving retraining and re-employment of those currently engaged in them.

Too higher price to pay?  Not when compared with the alternative which is to resist change and, in the interests of maximising profit, continue to move far too slowly to avert increasingly dangerous outcomes.  Young people rightly protest against this and those responsible for killing flora and fauna (which includes humans), destroying their habitat and giving impetus to the 6thmass extinction now in progress.


from Skeptical Science http://bit.ly/2WJDEYZ

Curiosity sees noctilucent clouds shining in Mars’ sky

Noctilucent clouds in motion in Mars’ sky, seen by the Curiosity rover, Sol 2410. Curiosity captured these clouds on Sol 2410 (May 18, 2019). The clouds are sunlit although the sun has set; they’re noctilucent clouds or night-shining clouds. The animation was assembled from 3 sets of 3 Navcam images. Via NASA /JPL-Caltech /Justin Cowart/Planetary Society.

Emily Lakdawalla of the Planetary Society reported recently that the Curiosity rover on Mars has been seeing noctilucent – or “night-shining” – clouds in Mars’ sky. That news comes just as the noctilucent cloud season begins for the northern part of Earth, too. We’re already hearing rumblings from the Facebook group Noctilucent clouds around the world that some European skywatchers have been spotting these clouds in recent nights. More about noctilucent clouds visible in earthly skies below. First, here’s what Lakdawalla had to say about the Curiosity rover’s view of these clouds on Mars; she wrote on May 28, 2019:

Curiosity has … been looking up after sunset recently. It’s been taking Navcam photos, and the camera’s reasonably broad field of view (45 degrees) lets it take in a lot of clouds, giving all of us back on Earth a chance to see them, too. [The image at the top of this page] is a spectacular set, which included 3 sets of 3 frames that can be assembled into a panoramic animation, here assembled by Justin Cowart.

Here’s another image, acquired by Curiosity on May 27, 2019. Lakdawalla points out that, although it doesn’t animate, it does cover a huge amount of the Martian sky:

Lakdawalla also wrote:

Prior views pointed at only one location in the sky, so they don’t have quite the impact of the panoramas. On the plus side, they contain more time steps. Here is one example.

Black-and-white animation of high, wispy, illuminated clouds in a night sky.

Noctilucent clouds in motion, Curiosity, Sol 2405. Curiosity looked upward after sunset on sol 2405 (May 13, 2019) and saw wispy cirrus clouds in motion, high above the ground. Because of their high elevation, the clouds are still sunlit, making them noctilucent clouds. Image via NASA/JPL-Caltech/Justin Cowart/Planetary Society.

Lakdawalla pointed out that these images from Mars have some downsides. For one thing, she wrote:

Because they are taken after sunset, Navcam requires long exposures to produce these images: 10 to 70 seconds. These unusually long exposures emphasize imperfections within the camera, making the images look ‘snowy,’ especially the 70-second exposure. It doesn’t matter. They’re still stunning.

And she pointed out the lack of color in the images:

Navcam is a monochrome camera, so it can’t do that. Curiosity’s color Mastcam could take color pictures, but with a much narrower field of view, denying us the panoramic landscape.

And that brings us to the subject of the following images of noctilucent clouds, taken not from Mars, but from our own Earth. In earthly skies, these clouds form in the highest reaches of our atmosphere – the mesosphere – as much as 50 miles (80 km) above the surface. They’re thought to be made of ice crystals that form on fine dust particles from meteors. They can only form when temperatures are incredibly low and when there’s water available to form ice crystals.

Colorful nighttime image of boats on a waterfront, with noctilucent clouds shining overhead.

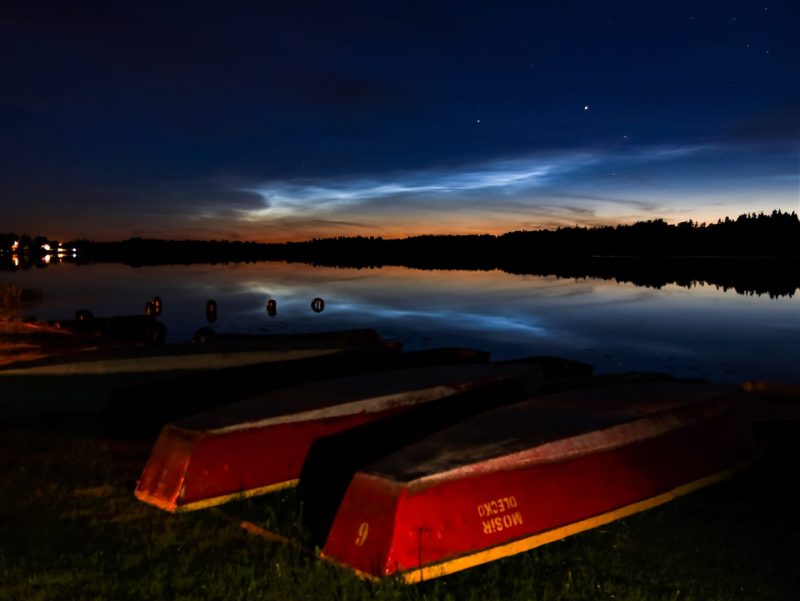
View at EarthSky Community Photos. | Noctilucent clouds or night-shining clouds seen over the Masurian Lake District of northern Poland on June 3, 2019, via Dorota Anna.

Earthly noctilucent clouds are a seasonal phenomenon, and the 2019 season for the Northern Hemisphere has barely begun. For best results, look for these clouds from about May through August in the Northern Hemisphere, and from November through February in the Southern Hemisphere. Now the bad news. They can’t be seen from everywhere on Earth, but are a high-latitude phenomenon. You need to be between about 45 degrees and 60 degrees north or south latitude to see noctilucent clouds.

That’s why we typically see photos of noctilucent clouds in Earth’s sky from people in Scandinavian or northern European countries. Adrien Louis Mauduit – who works for the Aurora Borealis Observatory on Norway’s Senja Island – also runs the Facebook page Noctilucent clouds around the world. That page is a great resource for those who want to see noctilucent clouds, or for those who are just curious about them. Adrien reported in late May that he was seeing the beginnings of the season for these clouds. If you’re at a high latitude in the Northern Hemisphere, watch for them in the weeks ahead!

Bottom line: Images from the Curiosity rover on Mars of noctilucent clouds seen shining at night, high in the Martian sky. Also, a few early images of noctilucent clouds seen on Earth as the observing season for them begins in 2019.

Post your noctilucent cloud photo at EarthSky Community Photos

Via the Planetary Society and Noctilucent clouds around the world


from EarthSky http://bit.ly/2WemFtn

adds 2