Reprint of article originally posted on UN NEWS on Nov 29, 2018. Click here to access the original.
As global temperatures continue to rise, climate action is lagging and the window of opportunity is closing. On Sunday, the United Nations will kick off critical negotiations on how to address the problem collectively and urgently, during a two-week climate change conference in Katowice, Poland, known as “COP24”.
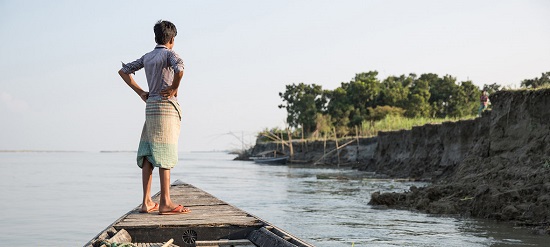
IOM/Amanda Nero A boy watches the shore from a boat near Sirajganj, a community affected by severe erosion that has left many displaced. Sirajganj, Bangladesh. October 2016
Thousands of world leaders, experts, activists, creative thinkers, and private sector and local community representatives will gather to work on a collective action plan to realize critical commitments made by all the countries of the world in Paris, three years ago.
UN News put together this guide to COP 24 to answer some of the biggest questions you may have and make sure you’re all caught up, with a ringside seat on the action.
1. The basics: UNFCCC, UNEP, WMO, IPCC, COP 24, Kyoto Protocol, Paris Agreement... can someone please make sense of all this?
These acronyms and place names all represent international tools and terms that, under the leadership of the UN, were created to help advance climate action globally. They all play a specific and different role in focussing us all on achieving environmental sustainability. Here’s how it fits together:
In 1992, the UN organised a major event in Rio de Janeiro called the Earth Summit, in which the UN Framework Convention on Climate Change (UNFCCC) was adopted.
In this treaty, nations agreed to "stabilize greenhouse gas concentrations in the atmosphere” to prevent dangerous interference from human activity on the climate system. Today, the treaty has 197 signatories. Every year since the treaty entered into force in 1994, a “conference of the parties” – a COP – is held to discuss how to move forward and, since there have been 23 COPs so far, this year’s will be the 24th, or “COP 24”.
Because the UNFCCC had non-binding limits on greenhouse gas emissions for individual countries and no enforcement mechanism, various “extensions” to this treaty were negotiated during these COPs, including: the famous Kyoto Protocol in 1997, which defined emission limits for developed nations to be achieved by 2012; and the Paris Agreement, adopted in 2015, in which all countries of the world agreed to step up efforts to limit global warming to 1.5°C above pre-industrial temperatures and boost climate action financing.
Two agencies support the scientific work of the UN on climate change: the UN Environment Programme (UNEP) and the World Meteorological Organization (WMO). Together, they set up the Intergovernmental Panel on Climate Change (IPCC) in 1988, which is made of hundreds of experts, dedicated to assessing data and providing reliable scientific evidence for the climate action negotiations, including the upcoming ones in Katowice.
2. The UN seems to be having a lot of conferences and summits on this subject… Is any of it, well... fruitful?
These meetings have been vital to find a global consensus on an issue that requires a global solution. Although progress has been much slower than needed, the process — which has been as challenging as it is ambitious – has worked to bring all countries with very different circumstances, together. Progress has been made every step of the way. Some of the concrete actions taken so far prove one thing: climate action has a real positive impact and can truly help us prevent the worst.
Here are some notable achievements so far:
- At least 57 countries have managed to bring their greenhouse gas emissions down to the levels required to curb global warming.
- There are at least 51 “carbon pricing” initiatives in the works; charging those who emit carbon dioxide per tonne emitted.
- In 2015, 18 high-income countries committed to donating US$100 billion a year for climate action in developing countries. So far, over $70 billion have been mobilised.
3. Why is everyone talking about the Paris Agreement?
The Paris document – which provides the world with the only viable option for addressing climate change – has been ratified by 184 parties, and entered into force in November 2016.
The commitments contained in it are significant:
- Limit global average temperature rise to well below 2°C and pursue efforts to limit the temperature increase to 1.5°C.
- Ramp up financing for climate action, including the annual $100 billion goal from donor nations for lower-income countries.
- Develop national climate plans by 2020, including their self-determined goals and targets.
- Protect beneficial ecosystems that absorb greenhouse gases, including forests.
- Strengthen resilience and reduce vulnerability to climate change.
- Finalize a work programme to implement the agreement in 2018.
The United States, which joined the Agreement in 2016, announced its intention in July 2017, to withdraw from it. However, the nation remains a party to the Agreement at least until November 2020, which is the earliest that it can legally request to withdraw from it.
4. Why is +1.5°C a critical line?
According to scientific research assessed by the IPCC, keeping global warming to no more than 1.5°C global average over pre-industrial levels, will help stave off devastating permanent damage to the planet and its people, including: the irreversible loss of habitat for animals in the Arctic and Antarctic; much more frequent instances of deadly extreme heat; water scarcity that could affect over 300 million people; the disappearance of coral reefs which are essential for entire communities and marine life; sea level rise which is threatening the future and economy of entire small island nations, etc.
All in all, the UN estimates that 420 million fewer people could be affected by climate change if we manage to stick to a 1.5°C increase, instead of 2°C.
We are still far from turning the corner toward a carbon-neutral future, and the need to move forward is greater than ever. The data tells us it is still possible to limit climate change to 1.5°C, but the window of opportunity is closing and it will require unprecedented changes in all aspects of society.
5. So why is COP 24 important?
This year’s COP in Katowice, Poland, is particularly crucial because 2018 is the deadline that the signatories of the Paris Agreement agreed upon in order to adopt a work programme for the implementation of the Paris commitments. This requires the singular most important ingredient: trust between all countries.
Among the many elements that need to be ironed out is the financing of climate action worldwide. Because the clock is ticking on climate change, the world cannot afford to waste more time: we must collectively agree on a bold, decisive, ambitious and accountable way forward.
The discussions will be based on scientific evidence gathered over the years and assessed by experts. Namely and primarily the following reports:
- October’s “wake up call” Report on Global Warming of 1.5˚C, by the IPCC.
- 2018 Emissions Gap Report, by UNEP.
- 2018 Bulletin on greenhouse gas concentrations, by the WMO.
- 2018 Ozone Depletion Assessment, by the WMO and UNEP.
7. How can you follow the discussions at COP24?
There are many ways you can keep up to speed on the action:
- Subscribe to our “Climate Change” newsletter topic here so you can receive daily UN News highlights from Poland;
- Check this page regularly, as it will collect all the top stories filed from Katowice.
- Follow the hashtag #ClimateAction on Twitter;
8. How can you participate in the discussion and do your part for climate action?
You can join the Climate Action ActNow.bot which will recommend everyday actions to save the planet and tally up the number of actions taken to measure the impact that collective action can have.
By sharing your climate action efforts on social media, you can help encourage more people to act as well.
In addition, the People’s Seat initiative, launched by the UNFCCC Secretariat, ensures you can contribute directly to the conversation at COP 24. So make sure to #TakeYourSeat and speak up!
9. What are some examples of initiatives that the UN is supporting to tackle climate change?
As the UN is mainstreaming environmental sustainability across is work, UN News has been highlighting some examples of projects, supported by UNEP or the UN Development Programme (UNDP), that show the pathway to climate action: in rural eastern Europe, farmers and entrepreneurs can cut emissions, one bog at a time; in the Lake Chad region, tens of thousands of drought-resistant trees are being planted; in Guatemala, the reintroduction of smallholder cocoa production in Guatemala is helping address both economic and environmental problems; in Bhutan, the power of traditional knowledge is being harnessed to support livelihoods and nature preservation; in Timor-Leste, a new generation of green infrastructure is being built; in the Democratic Republic of the Congo, small behavioural change is leading to great impact.
10. Why is the UN also planning a Climate Change Summit in 2019?
To build on the outcomes of COP 24, and to strengthen climate action and ambition at the highest possible levels, UN Secretary-General António Guterresis convening a Climate Change Summit next September. In advance of the 2020 deadline for countries to finalize their national climate plans, the Summit is designed to focus on practical initiatives to limit emissions and build resilience.
The Summit will focus on driving action in six areas: transition to renewable energy; funding of climate action and carbon pricing; reducing emissions from industry; using nature as a solution; sustainable cities and local action; and climate change resilience.
COP24: UN climate change conference, what’s at stake and what you need to know, UN News, Nov 29, 2018
Receive UN daily updates directly in your inbox - Subscribe here to “Climate Change” topic
from Skeptical Science https://ift.tt/2KNPV6l
Reprint of article originally posted on UN NEWS on Nov 29, 2018. Click here to access the original.
As global temperatures continue to rise, climate action is lagging and the window of opportunity is closing. On Sunday, the United Nations will kick off critical negotiations on how to address the problem collectively and urgently, during a two-week climate change conference in Katowice, Poland, known as “COP24”.
IOM/Amanda Nero A boy watches the shore from a boat near Sirajganj, a community affected by severe erosion that has left many displaced. Sirajganj, Bangladesh. October 2016
Thousands of world leaders, experts, activists, creative thinkers, and private sector and local community representatives will gather to work on a collective action plan to realize critical commitments made by all the countries of the world in Paris, three years ago.
UN News put together this guide to COP 24 to answer some of the biggest questions you may have and make sure you’re all caught up, with a ringside seat on the action.
1. The basics: UNFCCC, UNEP, WMO, IPCC, COP 24, Kyoto Protocol, Paris Agreement... can someone please make sense of all this?
These acronyms and place names all represent international tools and terms that, under the leadership of the UN, were created to help advance climate action globally. They all play a specific and different role in focussing us all on achieving environmental sustainability. Here’s how it fits together:
In 1992, the UN organised a major event in Rio de Janeiro called the Earth Summit, in which the UN Framework Convention on Climate Change (UNFCCC) was adopted.
In this treaty, nations agreed to "stabilize greenhouse gas concentrations in the atmosphere” to prevent dangerous interference from human activity on the climate system. Today, the treaty has 197 signatories. Every year since the treaty entered into force in 1994, a “conference of the parties” – a COP – is held to discuss how to move forward and, since there have been 23 COPs so far, this year’s will be the 24th, or “COP 24”.
Because the UNFCCC had non-binding limits on greenhouse gas emissions for individual countries and no enforcement mechanism, various “extensions” to this treaty were negotiated during these COPs, including: the famous Kyoto Protocol in 1997, which defined emission limits for developed nations to be achieved by 2012; and the Paris Agreement, adopted in 2015, in which all countries of the world agreed to step up efforts to limit global warming to 1.5°C above pre-industrial temperatures and boost climate action financing.
Two agencies support the scientific work of the UN on climate change: the UN Environment Programme (UNEP) and the World Meteorological Organization (WMO). Together, they set up the Intergovernmental Panel on Climate Change (IPCC) in 1988, which is made of hundreds of experts, dedicated to assessing data and providing reliable scientific evidence for the climate action negotiations, including the upcoming ones in Katowice.
2. The UN seems to be having a lot of conferences and summits on this subject… Is any of it, well... fruitful?
These meetings have been vital to find a global consensus on an issue that requires a global solution. Although progress has been much slower than needed, the process — which has been as challenging as it is ambitious – has worked to bring all countries with very different circumstances, together. Progress has been made every step of the way. Some of the concrete actions taken so far prove one thing: climate action has a real positive impact and can truly help us prevent the worst.
Here are some notable achievements so far:
- At least 57 countries have managed to bring their greenhouse gas emissions down to the levels required to curb global warming.
- There are at least 51 “carbon pricing” initiatives in the works; charging those who emit carbon dioxide per tonne emitted.
- In 2015, 18 high-income countries committed to donating US$100 billion a year for climate action in developing countries. So far, over $70 billion have been mobilised.
3. Why is everyone talking about the Paris Agreement?
The Paris document – which provides the world with the only viable option for addressing climate change – has been ratified by 184 parties, and entered into force in November 2016.
The commitments contained in it are significant:
- Limit global average temperature rise to well below 2°C and pursue efforts to limit the temperature increase to 1.5°C.
- Ramp up financing for climate action, including the annual $100 billion goal from donor nations for lower-income countries.
- Develop national climate plans by 2020, including their self-determined goals and targets.
- Protect beneficial ecosystems that absorb greenhouse gases, including forests.
- Strengthen resilience and reduce vulnerability to climate change.
- Finalize a work programme to implement the agreement in 2018.
The United States, which joined the Agreement in 2016, announced its intention in July 2017, to withdraw from it. However, the nation remains a party to the Agreement at least until November 2020, which is the earliest that it can legally request to withdraw from it.
4. Why is +1.5°C a critical line?
According to scientific research assessed by the IPCC, keeping global warming to no more than 1.5°C global average over pre-industrial levels, will help stave off devastating permanent damage to the planet and its people, including: the irreversible loss of habitat for animals in the Arctic and Antarctic; much more frequent instances of deadly extreme heat; water scarcity that could affect over 300 million people; the disappearance of coral reefs which are essential for entire communities and marine life; sea level rise which is threatening the future and economy of entire small island nations, etc.
All in all, the UN estimates that 420 million fewer people could be affected by climate change if we manage to stick to a 1.5°C increase, instead of 2°C.
We are still far from turning the corner toward a carbon-neutral future, and the need to move forward is greater than ever. The data tells us it is still possible to limit climate change to 1.5°C, but the window of opportunity is closing and it will require unprecedented changes in all aspects of society.
5. So why is COP 24 important?
This year’s COP in Katowice, Poland, is particularly crucial because 2018 is the deadline that the signatories of the Paris Agreement agreed upon in order to adopt a work programme for the implementation of the Paris commitments. This requires the singular most important ingredient: trust between all countries.
Among the many elements that need to be ironed out is the financing of climate action worldwide. Because the clock is ticking on climate change, the world cannot afford to waste more time: we must collectively agree on a bold, decisive, ambitious and accountable way forward.
The discussions will be based on scientific evidence gathered over the years and assessed by experts. Namely and primarily the following reports:
- October’s “wake up call” Report on Global Warming of 1.5˚C, by the IPCC.
- 2018 Emissions Gap Report, by UNEP.
- 2018 Bulletin on greenhouse gas concentrations, by the WMO.
- 2018 Ozone Depletion Assessment, by the WMO and UNEP.
7. How can you follow the discussions at COP24?
There are many ways you can keep up to speed on the action:
- Subscribe to our “Climate Change” newsletter topic here so you can receive daily UN News highlights from Poland;
- Check this page regularly, as it will collect all the top stories filed from Katowice.
- Follow the hashtag #ClimateAction on Twitter;
8. How can you participate in the discussion and do your part for climate action?
You can join the Climate Action ActNow.bot which will recommend everyday actions to save the planet and tally up the number of actions taken to measure the impact that collective action can have.
By sharing your climate action efforts on social media, you can help encourage more people to act as well.
In addition, the People’s Seat initiative, launched by the UNFCCC Secretariat, ensures you can contribute directly to the conversation at COP 24. So make sure to #TakeYourSeat and speak up!
9. What are some examples of initiatives that the UN is supporting to tackle climate change?
As the UN is mainstreaming environmental sustainability across is work, UN News has been highlighting some examples of projects, supported by UNEP or the UN Development Programme (UNDP), that show the pathway to climate action: in rural eastern Europe, farmers and entrepreneurs can cut emissions, one bog at a time; in the Lake Chad region, tens of thousands of drought-resistant trees are being planted; in Guatemala, the reintroduction of smallholder cocoa production in Guatemala is helping address both economic and environmental problems; in Bhutan, the power of traditional knowledge is being harnessed to support livelihoods and nature preservation; in Timor-Leste, a new generation of green infrastructure is being built; in the Democratic Republic of the Congo, small behavioural change is leading to great impact.
10. Why is the UN also planning a Climate Change Summit in 2019?
To build on the outcomes of COP 24, and to strengthen climate action and ambition at the highest possible levels, UN Secretary-General António Guterresis convening a Climate Change Summit next September. In advance of the 2020 deadline for countries to finalize their national climate plans, the Summit is designed to focus on practical initiatives to limit emissions and build resilience.
The Summit will focus on driving action in six areas: transition to renewable energy; funding of climate action and carbon pricing; reducing emissions from industry; using nature as a solution; sustainable cities and local action; and climate change resilience.
COP24: UN climate change conference, what’s at stake and what you need to know, UN News, Nov 29, 2018
Receive UN daily updates directly in your inbox - Subscribe here to “Climate Change” topic
from Skeptical Science https://ift.tt/2KNPV6l