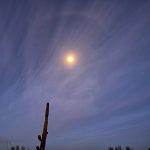
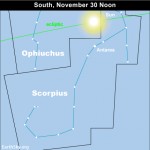
November 30, 2018. If you could see the stars in the daytime, you’d see the sun shining in front of the border of the constellations Ophiuchus and Scorpius on this date. The sun crosses a constellation boundary, into Ophiuchus.
You can’t see the constellation Ophiuchus when the sun lies in front of it. But, each Northern Hemisphere summer, you’ll find this constellation to the north of the bright star Antares in the constellation Scorpius.
At about this time each year, the sun passes out of Scorpius to enter Ophiuchus. Like Scorpius, Ophiuchus is a constellation of the zodiac … but unlike Scorpius, Ophiuchus is not one of the traditional twelve zodiacal constellations.
The sun will remain in front of Ophiuchus until December 18.
The ecliptic – which translates on our sky’s dome as the sun’s annual path in front of the background stars – actually passes through 13 constellations, as defined by the International Astronomical Union (IAU), although this is not commonly known. After all, when you read the horoscope in the daily newspaper or a monthly magazine, you see only 12 constellations, or signs, mentioned.
There are the 12 traditional zodiacal constellations that have been with us since ancient times. The relatively recent addition of Ophiuchus as a member of the zodiac has increased the number to 13.
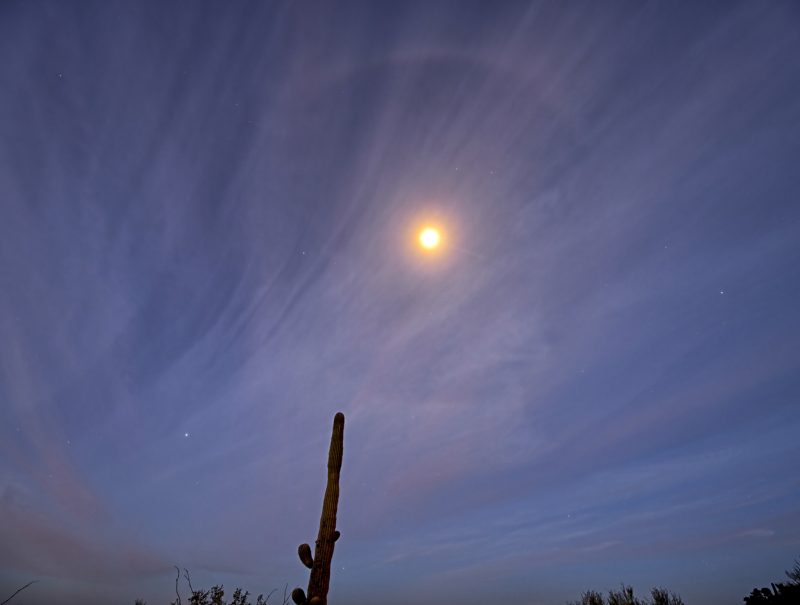
Look at the chart carefully, and you’ll see that the border between Ophiuchus and the constellation Scorpius for the most part lies just south of, or below, the ecliptic. In ancient times, the Ophuichus-Scorpius border was likely placed to the north of, or above, the ecliptic. Had the International Astronomical Union placed its constellation boundary where the ancients might have, the sun’s annual passing in front of Scorpius would be from about November 23 till December 18, not November 23 to November 30.
November 30, 2018. If you could see the stars in the daytime, you’d see the sun shining in front of the border of the constellations Ophiuchus and Scorpius on this date. The sun crosses a constellation boundary, into Ophiuchus.
You can’t see the constellation Ophiuchus when the sun lies in front of it. But, each Northern Hemisphere summer, you’ll find this constellation to the north of the bright star Antares in the constellation Scorpius.
At about this time each year, the sun passes out of Scorpius to enter Ophiuchus. Like Scorpius, Ophiuchus is a constellation of the zodiac … but unlike Scorpius, Ophiuchus is not one of the traditional twelve zodiacal constellations.
The sun will remain in front of Ophiuchus until December 18.
The ecliptic – which translates on our sky’s dome as the sun’s annual path in front of the background stars – actually passes through 13 constellations, as defined by the International Astronomical Union (IAU), although this is not commonly known. After all, when you read the horoscope in the daily newspaper or a monthly magazine, you see only 12 constellations, or signs, mentioned.
There are the 12 traditional zodiacal constellations that have been with us since ancient times. The relatively recent addition of Ophiuchus as a member of the zodiac has increased the number to 13.
Look at the chart carefully, and you’ll see that the border between Ophiuchus and the constellation Scorpius for the most part lies just south of, or below, the ecliptic. In ancient times, the Ophuichus-Scorpius border was likely placed to the north of, or above, the ecliptic. Had the International Astronomical Union placed its constellation boundary where the ancients might have, the sun’s annual passing in front of Scorpius would be from about November 23 till December 18, not November 23 to November 30.
Here we go again. It's always emails with these people.
First there was "Climategate!" — the misquoting, selective quoting, and uninformed quoting of stolen emails from the University of East Anglia's Climatic Research Unit (CRU) in Great Britain. Emails between CRU scientists and other climate scientists around the world promised to peel back the curtain and reveal the global warming scam. Alarmist scientists had used "tricks" to "hide the decline"! They "can't account for the lack of warming" so they have to fake the temperature data! The whole thing is a hoax!
Not so much.
With out-of-context quoting you can make scientists say anything. And that was the case with Climategate — it suffered from an extreme lack of context. The full context of the emails simply showed scientists discussing their work openly with each other. They show that they are merely human — they are argumentative as well as congratulatory; they get angry, with each other and the contrarians who attack them and their work.
Despite contrarians' promise to reveal the nefarious world of scheming scientists, the larger context of emails plus the peer-reviewed literature merely shows how science works. The literature gives us the finished products of scientific research, while the emails give us a glimpse of the back-and-forth between scientists as they hash out their experiments, data, and interpretations, and work toward publishing their results. This science has withstood assaults like Climategate (and the nothingburger Son of Climategate: Climategate II) because there is no nefarious world to reveal here.
But that has not stopped the contrarians from trying the same thing over and over again. The latest example is the use of Freedom of Information Act (FOIA) requests — which are designed to allow taxpayers to have access to certain government records — to litigate for the release of more emails. Of particular interest are the emails of one Michael E. Mann, because apparently all of climate science hinges on his work, especially the “Hockey Stick”. Show that Mann’s research is fake and the entire house of cards will crumble.
In 2011, the American Tradition Institute (ATI) brought a lawsuit against Dr. Mann and the University of Virginia (where Mann was a professor from 1999 to 2005) for the release of his emails, claiming that as a public university professor, Mann’s emails were effectively government records that should be turned over to anyone who asked under Virginia’s FOIA law. The case went all the way to the Virginia Supreme Court, which rejected this premise and blocked this email release in 2014.
What is a climate science denying outfit like ATI supposed to do? Move on to a more “compliant” state. ATI morphed into the Energy and Environment Legal Institute (E&E) and brought a lawsuit in Arizona against the University of Arizona and two of its professors: Malcolm Hughes, a coauthor of Mann’s on the famous Hockey Stick papers, and Jonathan Overpeck, a lead author on the IPCC’s fourth and fifth Assessment Reports.
E&E claims they are bringing these lawsuits in the interests of open science, to make the workings of scientific research available to all American arm-chair “scientists”. That sounds like a lofty goal. Except they also say they want the emails released in order to “embarrass both Professors Hughes and Overpeck and the University [of Arizona].” They also have not sought data, results, or other study information — only emails. Well, that doesn’t sound very “scientific”.
In the end, the courts in Arizona have proved to be more compliant than in Virginia: the emails will be released. But only after hours and hours of wasted time by Drs. Hughes and Overpeck in sifting through their years of emails to cull any truly confidential information:
Dr. Hughes testified it took him ten weeks to go through all the emails, and he lost an entire research summer to reviewing old emails as well as losing a grant that expired. Dr. Overpeck testified it took him six weeks to go through everything and he was unable to use his sabbatical. (Source)
This “wasted time” is another of the unstated goals of such lawsuits: take precious time away from climate scientists’ real research by burying them in frivolous busy-work.
Of course, I wish I did not need to do this. But since these emails will be handed over any day now to David Schnare [of E&E], it is our hope to use this exercise instead as a teaching moment and an opportunity to further public appreciation and understanding of science...
You can access Mann's emails here, (enter “mail_guest” for both username and password).
In days and weeks to come, contrarians (who think they are arm-chair scientists) might sift through the U of AZ emails in hopes of finding some nugget to embarrass Mann, Hughes, Overpeck or any of the numerous scientists they email every day in their effort to understand how the climate system works. They may uncover more “tricks” used by scientists as they describe their research. There may be strong disagreements between scientists. There may be ridicule of the contrarians who pepper scientists with amateurish questions.
But the hoped for climate change scam will still fail to materialize from this new batch of emails. Anyone reading these emails (really reading them — not just poking at them to try to find “gotcha” phrases) will find scientists merely working together to understand the climate, and trying to find the best way to communicate what they discover to the wider world.
Thanks to jg for the illustration.
from Skeptical Science https://ift.tt/2DQb2DI
Here we go again. It's always emails with these people.
First there was "Climategate!" — the misquoting, selective quoting, and uninformed quoting of stolen emails from the University of East Anglia's Climatic Research Unit (CRU) in Great Britain. Emails between CRU scientists and other climate scientists around the world promised to peel back the curtain and reveal the global warming scam. Alarmist scientists had used "tricks" to "hide the decline"! They "can't account for the lack of warming" so they have to fake the temperature data! The whole thing is a hoax!
Not so much.
With out-of-context quoting you can make scientists say anything. And that was the case with Climategate — it suffered from an extreme lack of context. The full context of the emails simply showed scientists discussing their work openly with each other. They show that they are merely human — they are argumentative as well as congratulatory; they get angry, with each other and the contrarians who attack them and their work.
Despite contrarians' promise to reveal the nefarious world of scheming scientists, the larger context of emails plus the peer-reviewed literature merely shows how science works. The literature gives us the finished products of scientific research, while the emails give us a glimpse of the back-and-forth between scientists as they hash out their experiments, data, and interpretations, and work toward publishing their results. This science has withstood assaults like Climategate (and the nothingburger Son of Climategate: Climategate II) because there is no nefarious world to reveal here.
But that has not stopped the contrarians from trying the same thing over and over again. The latest example is the use of Freedom of Information Act (FOIA) requests — which are designed to allow taxpayers to have access to certain government records — to litigate for the release of more emails. Of particular interest are the emails of one Michael E. Mann, because apparently all of climate science hinges on his work, especially the “Hockey Stick”. Show that Mann’s research is fake and the entire house of cards will crumble.
In 2011, the American Tradition Institute (ATI) brought a lawsuit against Dr. Mann and the University of Virginia (where Mann was a professor from 1999 to 2005) for the release of his emails, claiming that as a public university professor, Mann’s emails were effectively government records that should be turned over to anyone who asked under Virginia’s FOIA law. The case went all the way to the Virginia Supreme Court, which rejected this premise and blocked this email release in 2014.
What is a climate science denying outfit like ATI supposed to do? Move on to a more “compliant” state. ATI morphed into the Energy and Environment Legal Institute (E&E) and brought a lawsuit in Arizona against the University of Arizona and two of its professors: Malcolm Hughes, a coauthor of Mann’s on the famous Hockey Stick papers, and Jonathan Overpeck, a lead author on the IPCC’s fourth and fifth Assessment Reports.
E&E claims they are bringing these lawsuits in the interests of open science, to make the workings of scientific research available to all American arm-chair “scientists”. That sounds like a lofty goal. Except they also say they want the emails released in order to “embarrass both Professors Hughes and Overpeck and the University [of Arizona].” They also have not sought data, results, or other study information — only emails. Well, that doesn’t sound very “scientific”.
In the end, the courts in Arizona have proved to be more compliant than in Virginia: the emails will be released. But only after hours and hours of wasted time by Drs. Hughes and Overpeck in sifting through their years of emails to cull any truly confidential information:
Dr. Hughes testified it took him ten weeks to go through all the emails, and he lost an entire research summer to reviewing old emails as well as losing a grant that expired. Dr. Overpeck testified it took him six weeks to go through everything and he was unable to use his sabbatical. (Source)
This “wasted time” is another of the unstated goals of such lawsuits: take precious time away from climate scientists’ real research by burying them in frivolous busy-work.
Of course, I wish I did not need to do this. But since these emails will be handed over any day now to David Schnare [of E&E], it is our hope to use this exercise instead as a teaching moment and an opportunity to further public appreciation and understanding of science...
You can access Mann's emails here, (enter “mail_guest” for both username and password).
In days and weeks to come, contrarians (who think they are arm-chair scientists) might sift through the U of AZ emails in hopes of finding some nugget to embarrass Mann, Hughes, Overpeck or any of the numerous scientists they email every day in their effort to understand how the climate system works. They may uncover more “tricks” used by scientists as they describe their research. There may be strong disagreements between scientists. There may be ridicule of the contrarians who pepper scientists with amateurish questions.
But the hoped for climate change scam will still fail to materialize from this new batch of emails. Anyone reading these emails (really reading them — not just poking at them to try to find “gotcha” phrases) will find scientists merely working together to understand the climate, and trying to find the best way to communicate what they discover to the wider world.
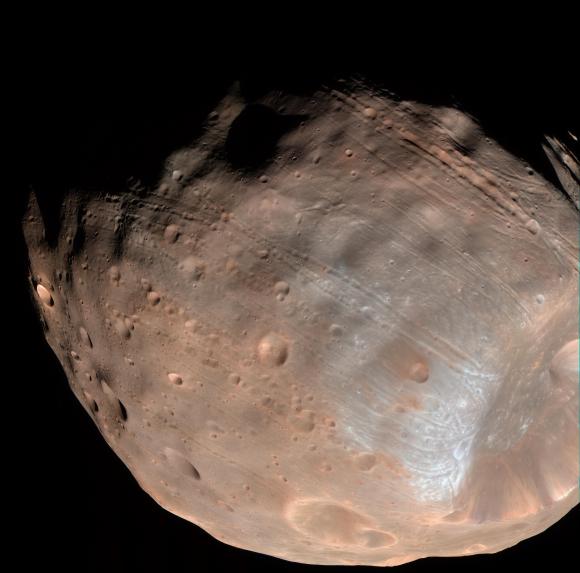
The tiny Martian moon Phobos, with its enigmatic grooves and Stickney crater in the bottom right corner of the image. Image via NASA/JPL-Caltech/University of Arizona.
Phobos is a very groovy moon, literally. The surface of this moon of Mars is covered with odd linear grooves, and for a long time scientists have wondered how they formed. Now, a new study from researchers at Brown University might have solved this mystery. The researchers say that boulders rolling across Phobos’ surface probably created the markings. The new peer-reviewed findings were published in Planetary and Space Science on November 16, 2018.
The study suggests that the rolling boulders were sprayed across the surface of Phobos during the impact that created the large Stickney crater on one end of the oblong Martian moon. The team used computer models to simulate the movement of debris from the crater. As Ken Ramsley, a planetary science researcher at Brown University who led the work explained:
These grooves are a distinctive feature of Phobos, and how they formed has been debated by planetary scientists for 40 years. We think this study is another step toward zeroing in on an explanation.
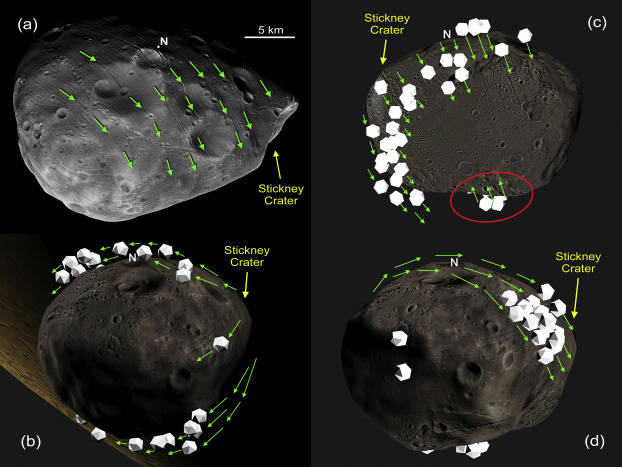
Computer models showing the possible paths of debris from the large Stickney crater on Phobos. Image via Ramsley et al/Brown University.
Computer simulation showing how boulders “flew over” one area of Phobos, leaving it devoid of grooves. Image via Ramsley et al/Brown University.
The grooves are a striking feature on this tiny moon of Mars, and were first seen by the Mariner and Viking missions in the 1970s. Another theory had been that the grooves were the result of structural failure in the moon, as Mars’ gravity is very slowly tearing the moon apart.
The idea of rolling boulders isn’t new, either. In the late 1970s, planetary scientists Lionel Wilson and Jim Head had also proposed the idea that bouncing, sliding and rolling boulders from Stickney might have created the grooves. Head is a co-author on the new paper.
It is also fortunate that the impact that created Stickney crater didn’t destroy Phobos. Stickney crater is about 5.6 miles (9 km) across and Phobos itself is only 16.7 miles (27 km) at its widest point. This little moon came perilously close to being smashed into smithereens, in the event that created Stickney crater.
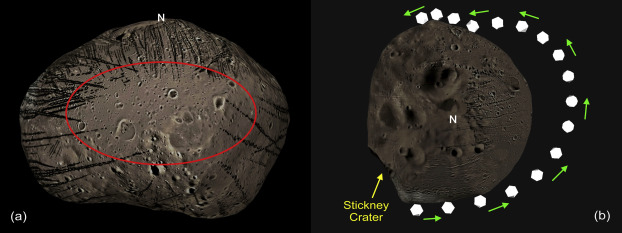
The new theory sounds pretty straightforward although there are still some nagging questions. Most of the grooves radiate away from Stickney crater, but some do not. Some grooves also lie on top of other grooves, showing that they were created at different times. How does that reconcile with all the grooves being created by a single impact? Other grooves even run right through Stickney crater itself. The crater must have already been there when those grooves formed, otherwise the impact that created the crater would have wiped them out in that area.
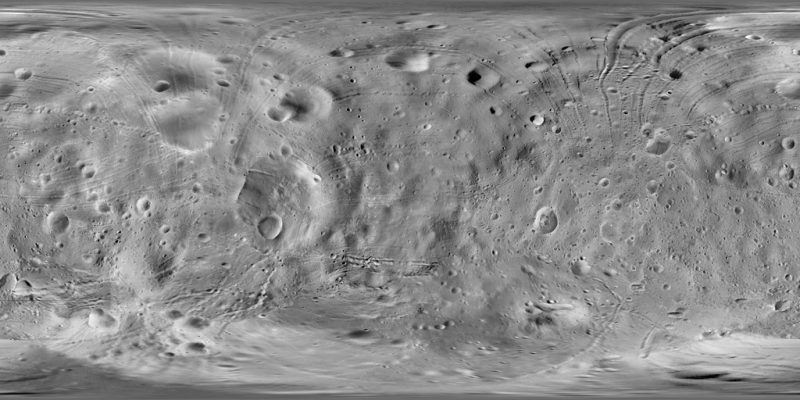
Global map of Phobos, taken by the Viking orbiter, showing the locations of all the grooves relative to other features. Image via Planetary Data System/Phil Stooke.
Despite those problems however, Ramsley found that the computer models re-created the groove patterns quite well, even though he didn’t know just what to expect:
The model is really just an experiment we run on a laptop. We put all the basic ingredients in, then we press the button and we see what happens.
The grooves tend to be parallel to each other, and according to the computer models, the boulders would have been ejected from the crater-forming impact in parallel paths as well. The boulders would also have kept rolling for much longer than on larger moons or planets, due to Phobos’ very weak gravity. If some boulders rolled all the way around the moon, that could explain why some grooves are not radially aligned to the crater. It could also explain the grooves formed on top of other grooves, since grooves that were created right after the impact were then crossed minutes to hours later by boulders completing their journeys around the moon, hence the time difference in their formation. Also, if some boulders did roll all the way around the moon, they could have rolled right across Stickney crater.
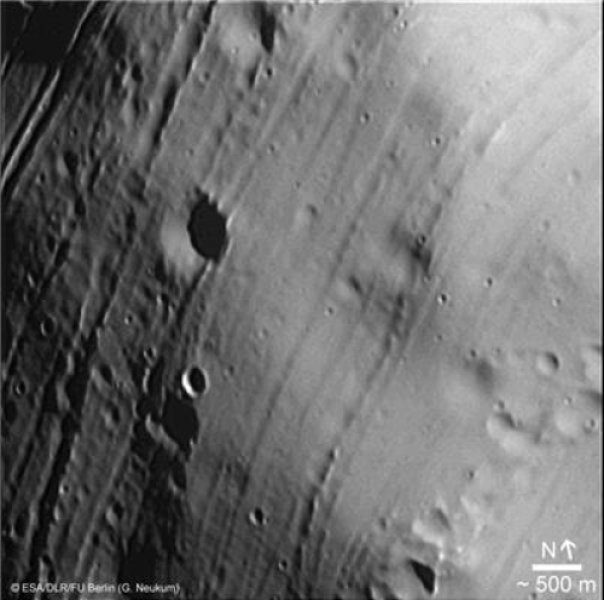
A closer view of some of the grooves from Mars Express. Image via ESA/DLR/FU Berlin (G. Neukum).
But what about the “bare spot” where there are no grooves? The computer simulations explain that also – the spot is a low-elevation area surrounded by a taller “lip.” The boulders would have hit that lip first, catapulting them over the region, and landing again on the other side. As Ramsley described it:
It’s like a ski jump. The boulders keep going but suddenly there’s no ground under them. They end up doing this suborbital flight over this zone.
So it seems like all of the odd features can be explained by these computer models. As Ramsley noted:
We think this makes a pretty strong case that it was this rolling boulder model accounts for most if not all the grooves on Phobos.
Bottom line: Mars’ moon Phobos is a very intriguing little world, with features that have perplexed scientists for decades. Now, thanks to advanced computer modeling from scientists at Brown University, we may finally know how this little world came to be so groovy.
The tiny Martian moon Phobos, with its enigmatic grooves and Stickney crater in the bottom right corner of the image. Image via NASA/JPL-Caltech/University of Arizona.
Phobos is a very groovy moon, literally. The surface of this moon of Mars is covered with odd linear grooves, and for a long time scientists have wondered how they formed. Now, a new study from researchers at Brown University might have solved this mystery. The researchers say that boulders rolling across Phobos’ surface probably created the markings. The new peer-reviewed findings were published in Planetary and Space Science on November 16, 2018.
The study suggests that the rolling boulders were sprayed across the surface of Phobos during the impact that created the large Stickney crater on one end of the oblong Martian moon. The team used computer models to simulate the movement of debris from the crater. As Ken Ramsley, a planetary science researcher at Brown University who led the work explained:
These grooves are a distinctive feature of Phobos, and how they formed has been debated by planetary scientists for 40 years. We think this study is another step toward zeroing in on an explanation.
Computer models showing the possible paths of debris from the large Stickney crater on Phobos. Image via Ramsley et al/Brown University.
Computer simulation showing how boulders “flew over” one area of Phobos, leaving it devoid of grooves. Image via Ramsley et al/Brown University.
The grooves are a striking feature on this tiny moon of Mars, and were first seen by the Mariner and Viking missions in the 1970s. Another theory had been that the grooves were the result of structural failure in the moon, as Mars’ gravity is very slowly tearing the moon apart.
The idea of rolling boulders isn’t new, either. In the late 1970s, planetary scientists Lionel Wilson and Jim Head had also proposed the idea that bouncing, sliding and rolling boulders from Stickney might have created the grooves. Head is a co-author on the new paper.
It is also fortunate that the impact that created Stickney crater didn’t destroy Phobos. Stickney crater is about 5.6 miles (9 km) across and Phobos itself is only 16.7 miles (27 km) at its widest point. This little moon came perilously close to being smashed into smithereens, in the event that created Stickney crater.
The new theory sounds pretty straightforward although there are still some nagging questions. Most of the grooves radiate away from Stickney crater, but some do not. Some grooves also lie on top of other grooves, showing that they were created at different times. How does that reconcile with all the grooves being created by a single impact? Other grooves even run right through Stickney crater itself. The crater must have already been there when those grooves formed, otherwise the impact that created the crater would have wiped them out in that area.
Global map of Phobos, taken by the Viking orbiter, showing the locations of all the grooves relative to other features. Image via Planetary Data System/Phil Stooke.
Despite those problems however, Ramsley found that the computer models re-created the groove patterns quite well, even though he didn’t know just what to expect:
The model is really just an experiment we run on a laptop. We put all the basic ingredients in, then we press the button and we see what happens.
The grooves tend to be parallel to each other, and according to the computer models, the boulders would have been ejected from the crater-forming impact in parallel paths as well. The boulders would also have kept rolling for much longer than on larger moons or planets, due to Phobos’ very weak gravity. If some boulders rolled all the way around the moon, that could explain why some grooves are not radially aligned to the crater. It could also explain the grooves formed on top of other grooves, since grooves that were created right after the impact were then crossed minutes to hours later by boulders completing their journeys around the moon, hence the time difference in their formation. Also, if some boulders did roll all the way around the moon, they could have rolled right across Stickney crater.
A closer view of some of the grooves from Mars Express. Image via ESA/DLR/FU Berlin (G. Neukum).
But what about the “bare spot” where there are no grooves? The computer simulations explain that also – the spot is a low-elevation area surrounded by a taller “lip.” The boulders would have hit that lip first, catapulting them over the region, and landing again on the other side. As Ramsley described it:
It’s like a ski jump. The boulders keep going but suddenly there’s no ground under them. They end up doing this suborbital flight over this zone.
So it seems like all of the odd features can be explained by these computer models. As Ramsley noted:
We think this makes a pretty strong case that it was this rolling boulder model accounts for most if not all the grooves on Phobos.
Bottom line: Mars’ moon Phobos is a very intriguing little world, with features that have perplexed scientists for decades. Now, thanks to advanced computer modeling from scientists at Brown University, we may finally know how this little world came to be so groovy.
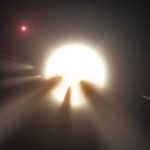
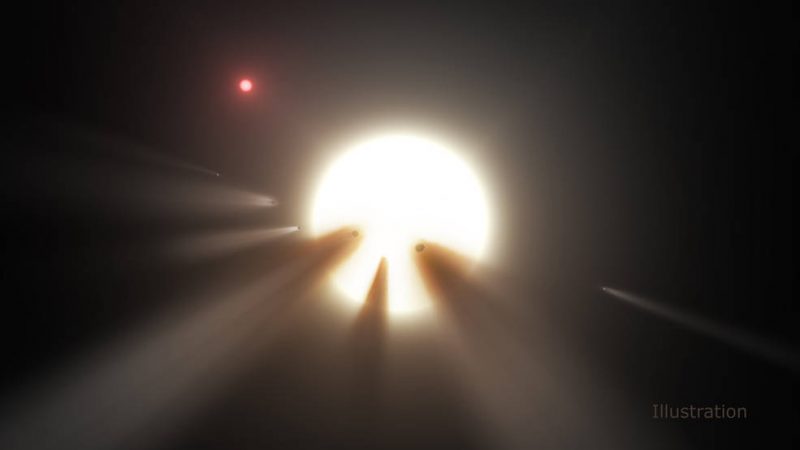
Artist’s concept of Tabby’s Star. It’s possible that dust causes its mysterious dips in brightness, which are similar to those in a newly found star, called VVV-WIT-07. Image via NASA/JPL-Caltech.
Remember Tabby’s Star? It periodically dims in a sporadic and mysterious way. For awhile, astronomers thought it might have an alien-built Dyson sphere around it, but now they think not. Astronomers have now found another mysteriously dimming star, perhaps similar to Tabby’s Star!
Tabby’s Star – aka Boyajian’s Star – created a lot of public interest last year and earlier this year when it started to “act up” again, periodically dimming in brightness in ways that astronomers still haven’t fully explained. It even brightened significantly more than usual sometimes. Although astronomers now know that fine dust near Tabby’s Star is at least part of the answer, they don’t yet know where this dust might come from, or why it is behaving the way it does. So the mystery of Tabby’s Star continues.
This month (November, 2018), astronomers have been hashing over what may be a newly discovered second star similar to Tabby’s Star. At least, the new-found star displays some similar characteristics. The star – called VVV-WIT-07 (for “What is this?”) was found by astronomers in Chile using the VISTA telescope in the Atacama Desert. Roberto Saito of the Federal University of Santa Catarina in Florianópolis, Brazil and his colleagues first reported the star’s odd flickering on November 6, 2018 in a peer-reviewed paper on arXiv.org. The findings were then reported in Science News on November 16. As Saito simply put it:
We don’t know what the object is, and that’s interesting.
Artist’s concept of VVV-WIT-07, which has been observed dipping in brightness in a manner similar to Tabby’s Star. Image via NASA/JPL-Caltech.
The team wasn’t actually looking for something like VVV-WIT-07, rather they were searching for supernovas – exploding stars – part of a larger survey of the center of the galaxy called the VISTA Variables in the Vía Láctea, or VVV.
But this star, like Tabby’s Star, suddenly dimmed. The star had been observed to periodically dim and brighten again before, between 2010 and 2018, with no set pattern, similar to Tabby’s Star. But while Tabby’s Star has been seen dimming as much as about 22%, this star was observed to suddenly dim as much as 80 percent! According to astronomer Tabetha Boyajian of Louisiana State University in Baton Rouge, who Tabby’s Star is named after:
If this phenomenon is the same as what’s happening with Tabby’s star, then we can’t invoke an elaborate explanation for what’s happening in both systems,” Boyajian says. “If you’re starting to see stars similar to this all over the place, then it’s got to be a really common thing that happens in nature. That’s really cool.
Light curve of VVV-WIT-007 from 2010-2018. The star dipped in brightness an incredible 80 percent in 2012 (shown in more detail in inset). Image via R. K. Saito et al.
If other stars could be found which dim in a similar manner, then they may be fairly common.
Astronomers are still not exactly sure what of star VVV-WIT-07 is even. It lies in the plane of the galaxy from our viewpoint, so there is a lot of dust that partially obscures it. If it’s a young variable star, then the dimming might simply be internal to the star itself. But if it’s not, then it is still a largely open question. As Boyajian noted:
Pretty much everything’s on the table for it right now. We need more data.
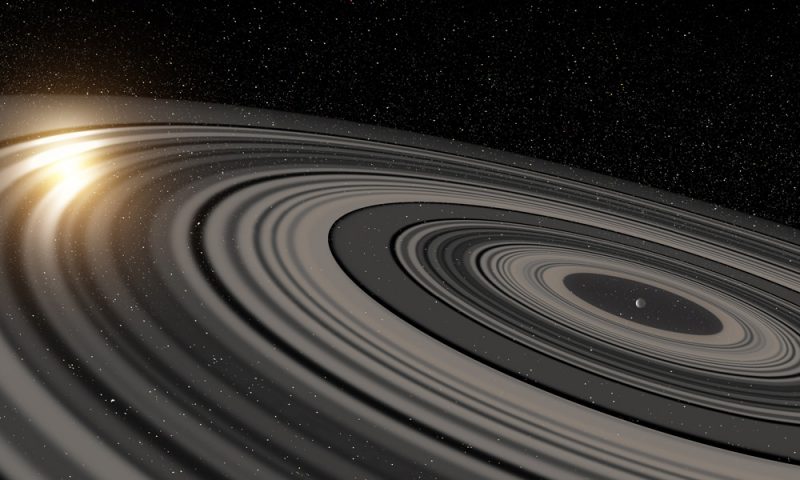
There is also another star – J1407 – that may be an even closer match to Tabby’s Star. that star has been observed to periodically dim by up to a whopping 95 percent. Astronomer Eric Mamajek of the University of Rochester in New York and his colleagues reported the discovery in 2012. Astronomers think that J1407 hosts an orbiting young giant planet or brown dwarf with an enormous ring system – much larger and heavier than Saturn’s – that periodically eclipses the star.
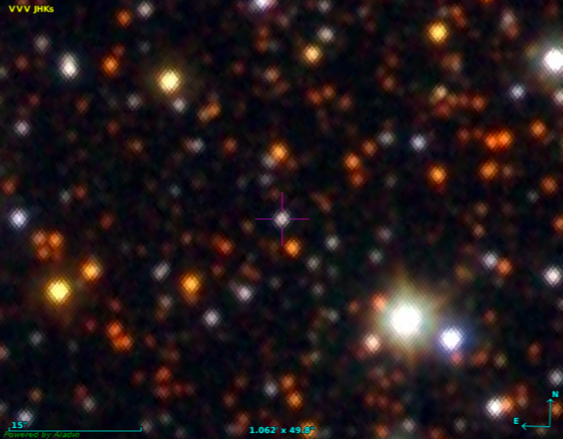
False-color image of VVV-WIT-007. Image via R. K. Saito et al.
According to Mamajek:
This planet is much larger than Jupiter or Saturn, and its ring system is roughly 200 times larger than Saturn’s rings are today. You could think of it as kind of a super Saturn.
The details that we see in the light curve are incredible. The eclipse lasted for several weeks, but you see rapid changes on time scales of tens of minutes as a result of fine structures in the rings. The star is much too far away to observe the rings directly, but we could make a detailed model based on the rapid brightness variations in the star light passing through the ring system. If we could replace Saturn’s rings with the rings around J1407b, they would be easily visible at night and be many times larger than the full moon.
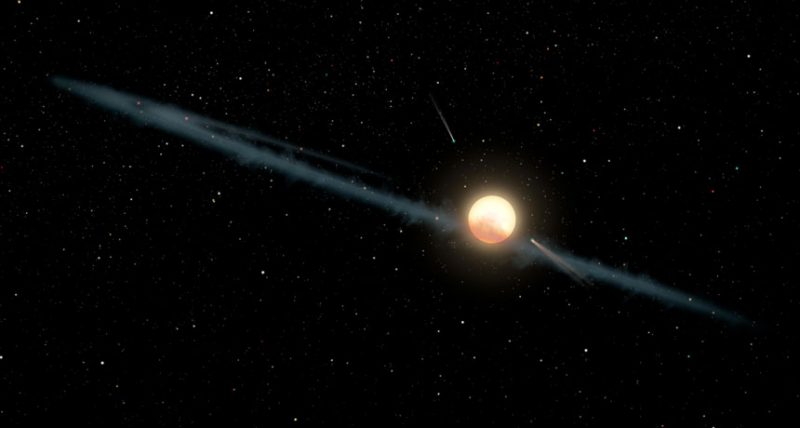
VVV-WIT-07 may also turn out to be more similar to J1407, where a giant young planet or brown dwarf with a gigantic ring system orbits the star. Image via Ron Miller.
Figuring out what is causing the weird dimming of VVV-WIT-07 – as with Tabby’s Star – will require further observations. Saito and his colleagues are hoping to be able to follow up using bigger telescopes, like the twin 8.1-meter Gemini telescopes or the Atacama Large Millimeter Array, both in Chile. Until then, astronomers can mostly just make educated guesses and come up with theories to explain the star’s behavior.
Bottom line: The mystery of Tabby’s Star still hasn’t been solved yet, and now there is another star that seems to be behaving in a similar manner – VVV-WIT-07. The findings made about one of them may help to solve the enigma of both – or it may turn out that there are two different exotic explanations for why these stars suddenly dip in brightness so much. Either way, what we learn about them should be very interesting.
Artist’s concept of Tabby’s Star. It’s possible that dust causes its mysterious dips in brightness, which are similar to those in a newly found star, called VVV-WIT-07. Image via NASA/JPL-Caltech.
Remember Tabby’s Star? It periodically dims in a sporadic and mysterious way. For awhile, astronomers thought it might have an alien-built Dyson sphere around it, but now they think not. Astronomers have now found another mysteriously dimming star, perhaps similar to Tabby’s Star!
Tabby’s Star – aka Boyajian’s Star – created a lot of public interest last year and earlier this year when it started to “act up” again, periodically dimming in brightness in ways that astronomers still haven’t fully explained. It even brightened significantly more than usual sometimes. Although astronomers now know that fine dust near Tabby’s Star is at least part of the answer, they don’t yet know where this dust might come from, or why it is behaving the way it does. So the mystery of Tabby’s Star continues.
This month (November, 2018), astronomers have been hashing over what may be a newly discovered second star similar to Tabby’s Star. At least, the new-found star displays some similar characteristics. The star – called VVV-WIT-07 (for “What is this?”) was found by astronomers in Chile using the VISTA telescope in the Atacama Desert. Roberto Saito of the Federal University of Santa Catarina in Florianópolis, Brazil and his colleagues first reported the star’s odd flickering on November 6, 2018 in a peer-reviewed paper on arXiv.org. The findings were then reported in Science News on November 16. As Saito simply put it:
We don’t know what the object is, and that’s interesting.
Artist’s concept of VVV-WIT-07, which has been observed dipping in brightness in a manner similar to Tabby’s Star. Image via NASA/JPL-Caltech.
The team wasn’t actually looking for something like VVV-WIT-07, rather they were searching for supernovas – exploding stars – part of a larger survey of the center of the galaxy called the VISTA Variables in the Vía Láctea, or VVV.
But this star, like Tabby’s Star, suddenly dimmed. The star had been observed to periodically dim and brighten again before, between 2010 and 2018, with no set pattern, similar to Tabby’s Star. But while Tabby’s Star has been seen dimming as much as about 22%, this star was observed to suddenly dim as much as 80 percent! According to astronomer Tabetha Boyajian of Louisiana State University in Baton Rouge, who Tabby’s Star is named after:
If this phenomenon is the same as what’s happening with Tabby’s star, then we can’t invoke an elaborate explanation for what’s happening in both systems,” Boyajian says. “If you’re starting to see stars similar to this all over the place, then it’s got to be a really common thing that happens in nature. That’s really cool.
Light curve of VVV-WIT-007 from 2010-2018. The star dipped in brightness an incredible 80 percent in 2012 (shown in more detail in inset). Image via R. K. Saito et al.
If other stars could be found which dim in a similar manner, then they may be fairly common.
Astronomers are still not exactly sure what of star VVV-WIT-07 is even. It lies in the plane of the galaxy from our viewpoint, so there is a lot of dust that partially obscures it. If it’s a young variable star, then the dimming might simply be internal to the star itself. But if it’s not, then it is still a largely open question. As Boyajian noted:
Pretty much everything’s on the table for it right now. We need more data.
There is also another star – J1407 – that may be an even closer match to Tabby’s Star. that star has been observed to periodically dim by up to a whopping 95 percent. Astronomer Eric Mamajek of the University of Rochester in New York and his colleagues reported the discovery in 2012. Astronomers think that J1407 hosts an orbiting young giant planet or brown dwarf with an enormous ring system – much larger and heavier than Saturn’s – that periodically eclipses the star.
False-color image of VVV-WIT-007. Image via R. K. Saito et al.
According to Mamajek:
This planet is much larger than Jupiter or Saturn, and its ring system is roughly 200 times larger than Saturn’s rings are today. You could think of it as kind of a super Saturn.
The details that we see in the light curve are incredible. The eclipse lasted for several weeks, but you see rapid changes on time scales of tens of minutes as a result of fine structures in the rings. The star is much too far away to observe the rings directly, but we could make a detailed model based on the rapid brightness variations in the star light passing through the ring system. If we could replace Saturn’s rings with the rings around J1407b, they would be easily visible at night and be many times larger than the full moon.
VVV-WIT-07 may also turn out to be more similar to J1407, where a giant young planet or brown dwarf with a gigantic ring system orbits the star. Image via Ron Miller.
Figuring out what is causing the weird dimming of VVV-WIT-07 – as with Tabby’s Star – will require further observations. Saito and his colleagues are hoping to be able to follow up using bigger telescopes, like the twin 8.1-meter Gemini telescopes or the Atacama Large Millimeter Array, both in Chile. Until then, astronomers can mostly just make educated guesses and come up with theories to explain the star’s behavior.
Bottom line: The mystery of Tabby’s Star still hasn’t been solved yet, and now there is another star that seems to be behaving in a similar manner – VVV-WIT-07. The findings made about one of them may help to solve the enigma of both – or it may turn out that there are two different exotic explanations for why these stars suddenly dip in brightness so much. Either way, what we learn about them should be very interesting.
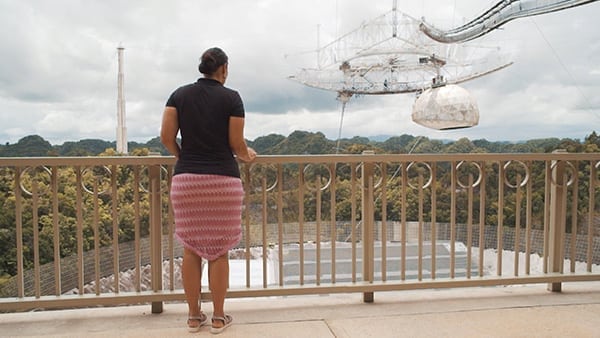
Wanda Diaz Merced speaks at TED2016 – Dream, February 15-19, 2016, Vancouver Convention Center, Vancouver, Canada.
By Graham Jones of Ten Sentences and Richard Gelderman, an astronomy professor and director of the Hardin Planetarium at Western Kentucky University. Interview by Richard Gelderman.
After losing her sight in her 20s, Wanda Díaz Merced became a pioneer of sonification, a technique for turning data into sounds. Her TED talk on How a blind astronomer found a way to hear the stars is one of TED’s most-watched astronomy videos. We caught up with Wanda at the General Assembly of the International Astronomical Union (IAU) in Vienna earlier this year.
Wanda Díaz Merced was deep in a conversation about her effort to draw more information out of an important data set. I was waiting to break into this discussion, introduce myself, and ask a question of this respected astronomer. To any onlooker, the energy and brightness shared as she expounded on the details of her research were no different from what we experience in encounter after encounter, all through each day, at the IAU General Assembly.
When I got the chance to introduce myself, Wanda’s hand was so confidently extended toward mine that I momentarily wondered if Wanda had at least partial use of her sight. This caught my attention, because I was there to ask a question about how she, as a person with complete loss of her eyesight, uses sound to experience multi-dimensional data sets and images.
Wanda was 19 years old and in the USA studying mathematics and physics at university when her first symptoms of blind spots occurred. Wanda was born with diabetic retinopathy, and it slowly destroyed her eyesight until she was completely blind at age 29.
Our ancestors believed that the movements of celestial bodies were a form of music – they called it the music of the spheres. Wanda Diaz Merced, a blind astrophysicist from Puerto Rico, studies the universe through sound and carries on this ancient tradition. Using Wanda’s actual sounds, this film weaves a journey of a truly unique scientist. Watch it here. Image via Wild & Scenic Music Festival.
During these difficult young adult years, Wanda resolved to find a way to continue her study of astronomy. At NASA-GSFC during a summer 2005 ACCESS internship, heliophysicist Robert Candey agreed that Wanda should be able to get as deeply involved with the data as any sighted astronomer. She used that encouragement to develop methods to turn plots into dimensions of time and pitch, loudness, or duration. As her efforts increased, they became the foundation of her groundbreaking PhD thesis from the University of Glasgow.
Wanda announced to the audience of her 2016 TED talk:
Information access empowers us to flourish.
However, creating a scientific playing field that is not dependent upon access to all five senses is only one aspect of Wanda’s research.
During our conversation at the IAU’s Inspiring Stars booth, I noted with some surprise as Wanda seamlessly transitioned from facing me, to pointing out a nearby demo, to turning to type on her laptop. She explained:
Without sight, I require a sequence to orient me.
Her work with sonification of digital data is an example of a similar organizational framework.
Astronomical research frequently involves the scrutiny of representations of digital data. Visual interpretation of plots is one way to pursue this goal, but the results of Wanda’s research show that combining sensory modalities makes anyone better at such interpretation.
The computer application interprets brightness, wavelength, position, or temporal information into pitch, loudness, or rhythm changing over time. It is these changes that Wanda listens for. She said:
I keep vigilant for the unexpected. Sensitivity to events increases when you use sound. In noisy data, those in our studies identify more peaks, dips, and pulses than just with sight.
Bottom line: Astronomer Wanda Díaz Merced explains how turning digital data into sound can help us find the patterns hidden in the information we receive from telescopes.