Story of the Week... Toon of the Week... Quote of the Week... SkS in the News... SkS Spotlights... Coming Soon on SkS... Climate Feedback Reviews... SkS Week in Review... Poster of the Week...
Story of the Week...
Startling new research finds large buildup of heat in the oceans, suggesting a faster rate of global warming

A post-sunset swimmer at Moonlight Beach in Encinitas, Calif., this month. (Mike Blake/Reuters)
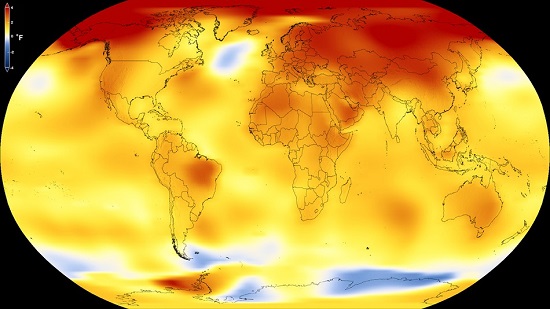
The world’s oceans have been soaking up far more excess heat in recent decades than scientists realized, suggesting that Earth could be set to warm even faster than predicted in the years ahead, according to new research published Wednesday.
Over the past quarter-century, Earth’s oceans have retained 60 percent more heat each year than scientists previously had thought, said Laure Resplandy, a geoscientist at Princeton University who led the startling study published Wednesday in the journal Nature. The difference represents an enormous amount of additional energy, originating from the sun and trapped by Earth’s atmosphere — the yearly amount representing more than eight times the world’s annual energy consumption.
In the scientific realm, the new findings help resolve long-running doubts about the rate of the warming of the oceans before 2007, when reliable measurements from devices called “Argo floats” were put to use worldwide. Before that, differing types of temperature records — and an overall lack of them — contributed to murkiness about how quickly the oceans were heating up.
The higher-than-expected amount of heat in the oceans means more heat is being retained within Earth’s climate system each year, rather than escaping into space. In essence, more heat in the oceans signals that global warming is more advanced than scientists thought.
Startling new research finds large buildup of heat in the oceans, suggesting a faster rate of global warming by Chris Moody & Brady Dennis, Energy & Environment, Washington Post, Oct 31, 2018
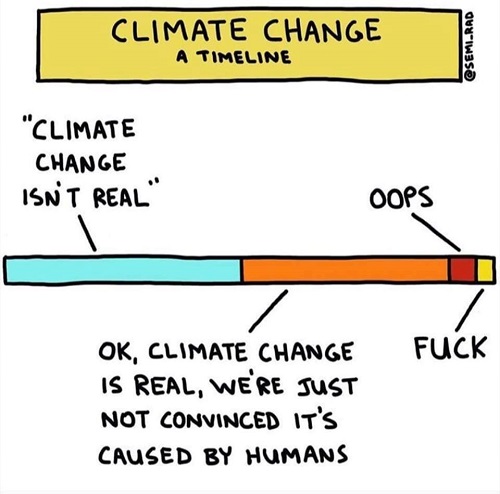
Toon of the Week...
SkS in the News...
In his Op-ed, In praise of 'real' science, published in the Times Colonist (Victoria, BC), Geof Johnson wrote:
In the online journal Skeptical Science, John Cook, a research assistant professor at the Centre for Climate Change Communication at George Mason University, writes: “The assertion that humans are, one way or another, at the root of global warming is the position of the academies of science from 80 countries.”
Quote of the Week
“We thought that we got away with not a lot of warming in both the ocean and the atmosphere for the amount of CO2 that we emitted,” said Resplandy, who published the work with experts from the Scripps Institution of Oceanography and several other institutions in the United States, China, France and Germany. “But we were wrong. The planet warmed more than we thought. It was hidden from us just because we didn’t sample it right. But it was there. It was in the ocean already.”
Startling new research finds large buildup of heat in the oceans, suggesting a faster rate of global warming by Chris Moody & Brady Dennis, Energy & Environment, Washington Post, Oct 31, 2018
SkS Spotlights...

Climate Action 100+ is a five-year initiative led by investors to engage systemically important greenhouse gas emitters and other companies across the global economy that have significant opportunities to drive the clean energy transition and help achieve the goals of the Paris Agreement. Investors are calling on companies to improve governance on climate change, curb emissions and strengthen climate-related financial disclosures.
Investor representatives from AustralianSuper, California Public Employees’ Retirement System (CalPERS), HSBC Global Asset Management, Ircantec and Manulife Asset Management have helped to lead the design and development of Climate Action 100+. The initiative is coordinated by five partner organisations: Asia Investor Group on Climate Change (AIGCC); Ceres; Investor Group on Climate Change (IGCC); Institutional Investors Group on Climate Change (IIGCC); and Principles for Responsible Investment (PRI). It builds on the successful investor engagement programmes coordinated by the partner organisations over a number of years.
Coming Soon on SkS...
- How (not) to talk about climate change (Climate Adam)
- Climate sensitivity uncertainties leading to more concern (Greenman)
- Climate change science comeback strategies: 'In it for the money' (Karin Kirk)
- What the US midterm election means for climate change (Dana)
- New research this week (Ari)
- 2018 SkS Weekly Climate Change & Global Warming News Roundup #45 (John Hartz)
- 2018 SkS Weekly Climate Change & Global Warming Digest #45 (John Hartz)
Climate Feedback Reviews
Washington Post accurately describes ocean warming study with potential implications for future carbon budget
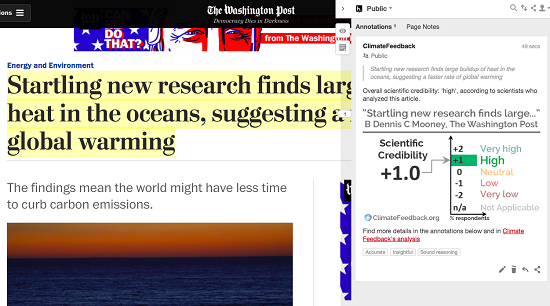
Climate Feedback asked a team of scientists to analyze the article, Startling new research finds large buildup of heat in the oceans, suggesting a faster rate of global warming by Chris Moody & Brady Dennis, Energy & Environment, Washington Post, Oct 31, 2018
Three scientists analyzed the article and estimate its overall scientific credibility to be 'high'.
A majority of reviewers tagged the article as: Accurate, Insightful, Sound reasoning.
Review Summary
This article in The Washington Post covers a new study estimating the amount of heat energy that has accumulated in the ocean in recent decades. Such estimates have been limited because the most complete network of ocean temperatures did not exist until the 2000s. The new study uses an indirect method, instead relying on changes in atmospheric gases caused by warmer oceans. This method leads to a larger estimate of the ocean warming that resulted from human activities.
Scientists who reviewed the article found that it did a good job of describing the study, while noting that the study’s conclusions (and implications) require additional investigation. In particular, discussion among scientists has focused on clarifying what impact this study’s results have on our understanding of climate sensitivity (how much warming occurs from a given amount of greenhouse gas emissions) and, consequently, how much the world can emit before reaching 2 °C warming.
Washington Post accurately describes ocean warming study with potential implications for future carbon budget, Edited by Scott Johnson, Climate Feedback, Nov 3, 2018
SkS Week in Review...
- 2018 SkS Weekly Climate Change & Global Warming News Roundup #44 by John Hartz
- New research, October 22-28, 2018 by Ari Jokimäki
- Climate impacts, Guest Post by And Then There's Physics (ATTP)
- China's Greenhouse Gas Emissions by Riduna
- A eulogy to Guardian's Climate Consensus - the 97% by Dana1981
- Canada passed a carbon tax that will give most Canadians more money by Dana Nuccitelli (Climate Consensus - the 97%, environment, Guardian)
- 2018 SkS Weekly Climate Change & Global Warming Digest #43 by John Hartz
Poster of the Week...

from Skeptical Science https://ift.tt/2zqrG98
Story of the Week... Toon of the Week... Quote of the Week... SkS in the News... SkS Spotlights... Coming Soon on SkS... Climate Feedback Reviews... SkS Week in Review... Poster of the Week...
Story of the Week...
Startling new research finds large buildup of heat in the oceans, suggesting a faster rate of global warming
A post-sunset swimmer at Moonlight Beach in Encinitas, Calif., this month. (Mike Blake/Reuters)
The world’s oceans have been soaking up far more excess heat in recent decades than scientists realized, suggesting that Earth could be set to warm even faster than predicted in the years ahead, according to new research published Wednesday.
Over the past quarter-century, Earth’s oceans have retained 60 percent more heat each year than scientists previously had thought, said Laure Resplandy, a geoscientist at Princeton University who led the startling study published Wednesday in the journal Nature. The difference represents an enormous amount of additional energy, originating from the sun and trapped by Earth’s atmosphere — the yearly amount representing more than eight times the world’s annual energy consumption.
In the scientific realm, the new findings help resolve long-running doubts about the rate of the warming of the oceans before 2007, when reliable measurements from devices called “Argo floats” were put to use worldwide. Before that, differing types of temperature records — and an overall lack of them — contributed to murkiness about how quickly the oceans were heating up.
The higher-than-expected amount of heat in the oceans means more heat is being retained within Earth’s climate system each year, rather than escaping into space. In essence, more heat in the oceans signals that global warming is more advanced than scientists thought.
Startling new research finds large buildup of heat in the oceans, suggesting a faster rate of global warming by Chris Moody & Brady Dennis, Energy & Environment, Washington Post, Oct 31, 2018
Toon of the Week...
SkS in the News...
In his Op-ed, In praise of 'real' science, published in the Times Colonist (Victoria, BC), Geof Johnson wrote:
In the online journal Skeptical Science, John Cook, a research assistant professor at the Centre for Climate Change Communication at George Mason University, writes: “The assertion that humans are, one way or another, at the root of global warming is the position of the academies of science from 80 countries.”
Quote of the Week
“We thought that we got away with not a lot of warming in both the ocean and the atmosphere for the amount of CO2 that we emitted,” said Resplandy, who published the work with experts from the Scripps Institution of Oceanography and several other institutions in the United States, China, France and Germany. “But we were wrong. The planet warmed more than we thought. It was hidden from us just because we didn’t sample it right. But it was there. It was in the ocean already.”
Startling new research finds large buildup of heat in the oceans, suggesting a faster rate of global warming by Chris Moody & Brady Dennis, Energy & Environment, Washington Post, Oct 31, 2018
SkS Spotlights...
Climate Action 100+ is a five-year initiative led by investors to engage systemically important greenhouse gas emitters and other companies across the global economy that have significant opportunities to drive the clean energy transition and help achieve the goals of the Paris Agreement. Investors are calling on companies to improve governance on climate change, curb emissions and strengthen climate-related financial disclosures.
Investor representatives from AustralianSuper, California Public Employees’ Retirement System (CalPERS), HSBC Global Asset Management, Ircantec and Manulife Asset Management have helped to lead the design and development of Climate Action 100+. The initiative is coordinated by five partner organisations: Asia Investor Group on Climate Change (AIGCC); Ceres; Investor Group on Climate Change (IGCC); Institutional Investors Group on Climate Change (IIGCC); and Principles for Responsible Investment (PRI). It builds on the successful investor engagement programmes coordinated by the partner organisations over a number of years.
Coming Soon on SkS...
- How (not) to talk about climate change (Climate Adam)
- Climate sensitivity uncertainties leading to more concern (Greenman)
- Climate change science comeback strategies: 'In it for the money' (Karin Kirk)
- What the US midterm election means for climate change (Dana)
- New research this week (Ari)
- 2018 SkS Weekly Climate Change & Global Warming News Roundup #45 (John Hartz)
- 2018 SkS Weekly Climate Change & Global Warming Digest #45 (John Hartz)
Climate Feedback Reviews
Washington Post accurately describes ocean warming study with potential implications for future carbon budget
Climate Feedback asked a team of scientists to analyze the article, Startling new research finds large buildup of heat in the oceans, suggesting a faster rate of global warming by Chris Moody & Brady Dennis, Energy & Environment, Washington Post, Oct 31, 2018
Three scientists analyzed the article and estimate its overall scientific credibility to be 'high'.
A majority of reviewers tagged the article as: Accurate, Insightful, Sound reasoning.
Review Summary
This article in The Washington Post covers a new study estimating the amount of heat energy that has accumulated in the ocean in recent decades. Such estimates have been limited because the most complete network of ocean temperatures did not exist until the 2000s. The new study uses an indirect method, instead relying on changes in atmospheric gases caused by warmer oceans. This method leads to a larger estimate of the ocean warming that resulted from human activities.
Scientists who reviewed the article found that it did a good job of describing the study, while noting that the study’s conclusions (and implications) require additional investigation. In particular, discussion among scientists has focused on clarifying what impact this study’s results have on our understanding of climate sensitivity (how much warming occurs from a given amount of greenhouse gas emissions) and, consequently, how much the world can emit before reaching 2 °C warming.
Washington Post accurately describes ocean warming study with potential implications for future carbon budget, Edited by Scott Johnson, Climate Feedback, Nov 3, 2018
SkS Week in Review...
- 2018 SkS Weekly Climate Change & Global Warming News Roundup #44 by John Hartz
- New research, October 22-28, 2018 by Ari Jokimäki
- Climate impacts, Guest Post by And Then There's Physics (ATTP)
- China's Greenhouse Gas Emissions by Riduna
- A eulogy to Guardian's Climate Consensus - the 97% by Dana1981
- Canada passed a carbon tax that will give most Canadians more money by Dana Nuccitelli (Climate Consensus - the 97%, environment, Guardian)
- 2018 SkS Weekly Climate Change & Global Warming Digest #43 by John Hartz
Poster of the Week...
from Skeptical Science https://ift.tt/2zqrG98