Various sources give wildly different dates for the peak date of the long-lasting South Taurid meteor shower (active from late September to late November). November 5, 2018 is one of those predicted dates. Thus the nights this weekend – and especially both November 4 and November 5, 2018 – are good nights to watch for meteors, possibly featuring a higher-than-average rate of South Taurid meteors.
After a night of watching Taurid meteors, you just might lucky enough to catch the moon and Venus before daybreak.
There are actually two streams of Taurid meteors. Both the South and North Taurids (active from late October to early December, and which peak somewhere around November 12) are long, spread-out showers with no well-defined peak. If tonight and tomorrow are peak nights for the South Taurid meteor shower, you might see as many as five meteors per hour. But The American Meteor Society explains what’s awesome about the Taurid meteor showers:
The Taurids (both branches) are rich in fireballs and are often responsible for increased number of fireball reports from September through November.
Yes! Fireballs are the name of the game for the Taurids.
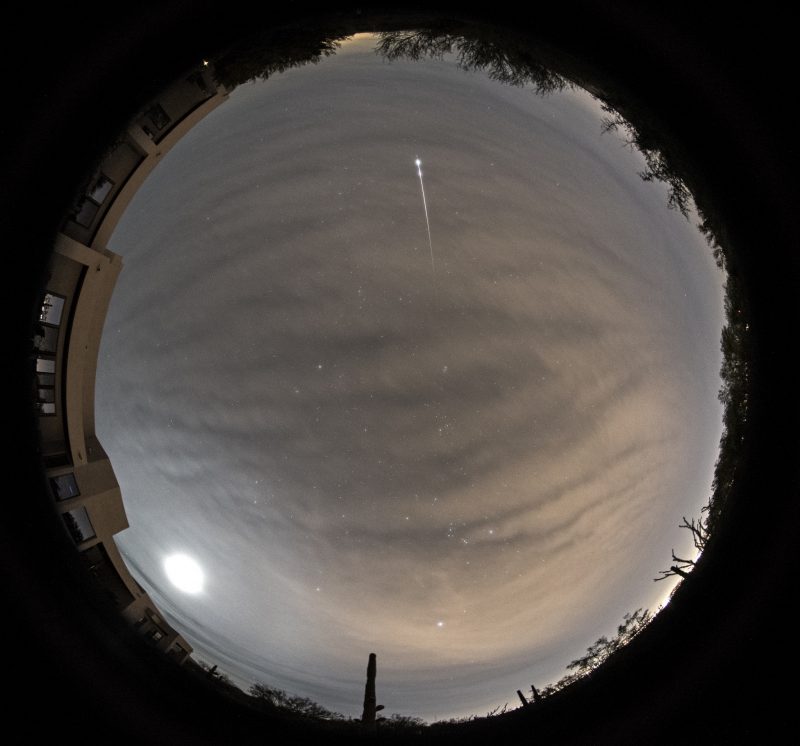
Eliot Herman in Tuscon, Arizona caught this bright Taurid on October 28, 2016. Go to his Flickr page if you want to see it larger. Nice colors!
Seeing a Taurid fireball – even if it’s just one – counts as a big thrill. And, by the way, a fireball is just another word for a particularly bright meteor.
What’s more, for once, the moon is cooperating.
The moon is now in a waning crescent phase. Rising shortly before sunrise, that means no moonlight to ruin the prime time viewing hours, centered on about 12:30 a.m. local time.
We’re guaranteed to have deliciously dark skies for the South Taurids tonight and tomorrow, to highlight any Taurid fireball that might come whizzing by.
You can see this meteor is radiating from the constellation Taurus the Bull. See that V-shaped pattern to the right of Orion? The three Belt stars of Orion point to it. That’s the Bull’s Face. Eliot Herman in Tucson caught this Taurid meteor, too, in 2015. The bright object was the moon! Thanks, Elliot.
The other Taurid shower – the North Taurids – should add a few more meteors to the mix from late night until dawn.
And again … the Taurid showers do not exhibit strong peaks. So if you’re clouded out tonight and tomorrow, no problem. Just keep watching. The two Taurid showers tend to overlap and to plateau in activity during the first few weeks in November.
On any given night, these rather slow-moving meteors produce the greatest numbers in the few hours after midnight.
Skywatchers are still remembering the Taurid fireballs they saw in 2015. The Taurids appear to have a 7-year cycle of bright fireballs, and 2015 was apparently a peak year! Read more about that, and see more fireball photos, here.
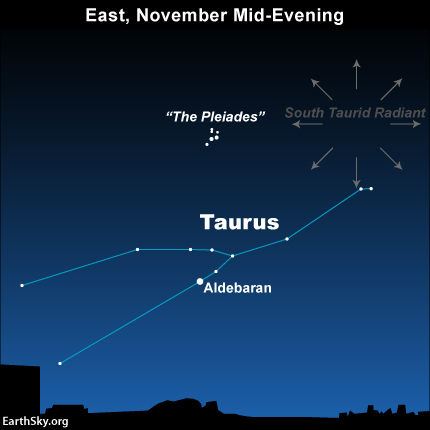
If you trace the South Taurid meteors backwards, they all appear to radiate from the constellation Taurus the Bull. As always, you don’t have to identify a meteor shower’s radiant point to watch the meteor shower. Just lie back comfortably and look up, in the hours between midnight and dawn.
By the way, the constellation Taurus itself is full of interesting things to see such as the Pleiades star cluster, the V-shaped Hyades cluster with bright Aldebaran in its midst.
Just be aware … you don’t need to find Taurus to watch the Taurid shower, for these meteors streak all over the sky.

View larger. | The three stars of Orion always point to Aldebaran, the fiery eye of the Bull in the constellation Taurus.
Bottom line: The annual South Taurid meteor shower has been going on throughout October, and now the North Taurids have started at well. The peaks of these showers aren’t well defined. What’s cool about them are the possibility of fireballs, or very bright meteors … watch for them!
Enjoying EarthSky so far? Sign up for our free daily newsletter today!
EarthSky’s meteor shower guide for 2018
See it! Best photos of 2015 Taurid fireballs
from EarthSky https://ift.tt/2OmUq7U
Various sources give wildly different dates for the peak date of the long-lasting South Taurid meteor shower (active from late September to late November). November 5, 2018 is one of those predicted dates. Thus the nights this weekend – and especially both November 4 and November 5, 2018 – are good nights to watch for meteors, possibly featuring a higher-than-average rate of South Taurid meteors.
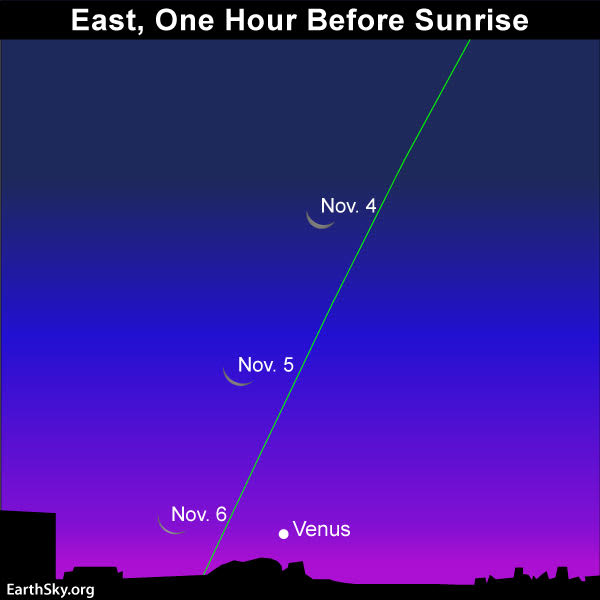
After a night of watching Taurid meteors, you just might lucky enough to catch the moon and Venus before daybreak.
There are actually two streams of Taurid meteors. Both the South and North Taurids (active from late October to early December, and which peak somewhere around November 12) are long, spread-out showers with no well-defined peak. If tonight and tomorrow are peak nights for the South Taurid meteor shower, you might see as many as five meteors per hour. But The American Meteor Society explains what’s awesome about the Taurid meteor showers:
The Taurids (both branches) are rich in fireballs and are often responsible for increased number of fireball reports from September through November.
Yes! Fireballs are the name of the game for the Taurids.
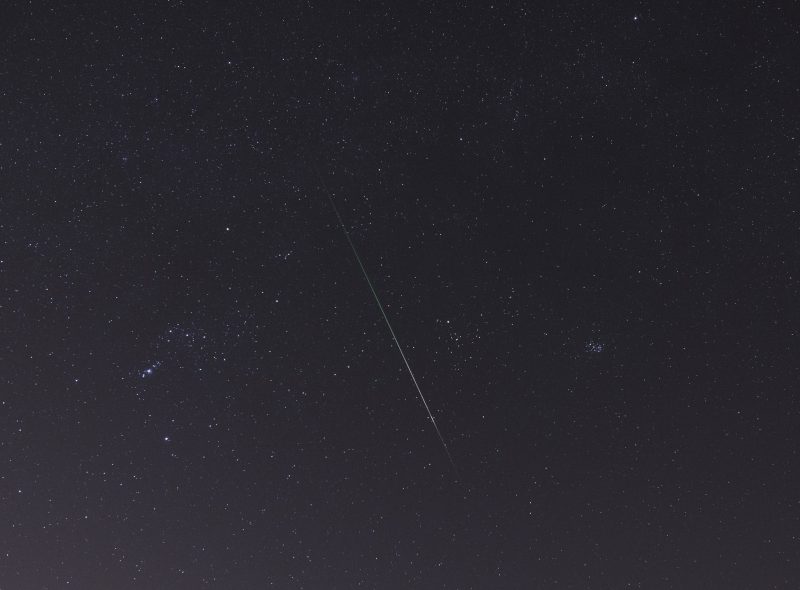
Eliot Herman in Tuscon, Arizona caught this bright Taurid on October 28, 2016. Go to his Flickr page if you want to see it larger. Nice colors!
Seeing a Taurid fireball – even if it’s just one – counts as a big thrill. And, by the way, a fireball is just another word for a particularly bright meteor.
What’s more, for once, the moon is cooperating.
The moon is now in a waning crescent phase. Rising shortly before sunrise, that means no moonlight to ruin the prime time viewing hours, centered on about 12:30 a.m. local time.
We’re guaranteed to have deliciously dark skies for the South Taurids tonight and tomorrow, to highlight any Taurid fireball that might come whizzing by.
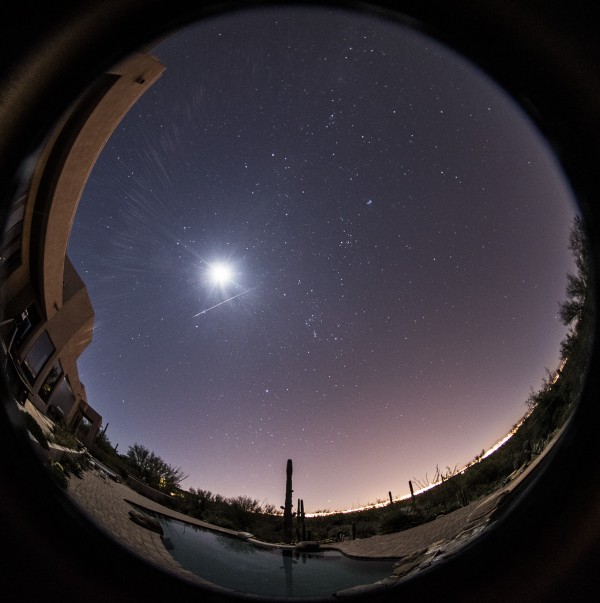
You can see this meteor is radiating from the constellation Taurus the Bull. See that V-shaped pattern to the right of Orion? The three Belt stars of Orion point to it. That’s the Bull’s Face. Eliot Herman in Tucson caught this Taurid meteor, too, in 2015. The bright object was the moon! Thanks, Elliot.
The other Taurid shower – the North Taurids – should add a few more meteors to the mix from late night until dawn.
And again … the Taurid showers do not exhibit strong peaks. So if you’re clouded out tonight and tomorrow, no problem. Just keep watching. The two Taurid showers tend to overlap and to plateau in activity during the first few weeks in November.
On any given night, these rather slow-moving meteors produce the greatest numbers in the few hours after midnight.
Skywatchers are still remembering the Taurid fireballs they saw in 2015. The Taurids appear to have a 7-year cycle of bright fireballs, and 2015 was apparently a peak year! Read more about that, and see more fireball photos, here.
If you trace the South Taurid meteors backwards, they all appear to radiate from the constellation Taurus the Bull. As always, you don’t have to identify a meteor shower’s radiant point to watch the meteor shower. Just lie back comfortably and look up, in the hours between midnight and dawn.
By the way, the constellation Taurus itself is full of interesting things to see such as the Pleiades star cluster, the V-shaped Hyades cluster with bright Aldebaran in its midst.
Just be aware … you don’t need to find Taurus to watch the Taurid shower, for these meteors streak all over the sky.
View larger. | The three stars of Orion always point to Aldebaran, the fiery eye of the Bull in the constellation Taurus.
Bottom line: The annual South Taurid meteor shower has been going on throughout October, and now the North Taurids have started at well. The peaks of these showers aren’t well defined. What’s cool about them are the possibility of fireballs, or very bright meteors … watch for them!
Enjoying EarthSky so far? Sign up for our free daily newsletter today!
EarthSky’s meteor shower guide for 2018
See it! Best photos of 2015 Taurid fireballs
from EarthSky https://ift.tt/2OmUq7U