This is a re-post from Carbon Brief. Dr Andrew King is a climate scientist at the University of Melbourne and Dr Markus Donat is a climate scientist at the University of New South Wales
As summer gets underway in the northern hemisphere, much of Europe has already been basking in temperatures of 30C and beyond.
But while the summer sun sends many flocking to the beach, with it comes the threat of heatwaves and their potentially deadly impacts. Tens of thousands of people across Europe died in heatwaves in 2003 and 2010, for example, while the “Lucifer” heatwave last year fanned forest fires and nearly halved agricultural output in some countries.
With international ambition to limit global temperature rise to “well below” 2C above pre-industrial levels now enshrined in the Paris Agreement, we have examined what impact that warming could have on European summer temperatures.
Our results, published today in Nature Climate Change, find that more than 100 million Europeans will typically see summer heat that exceeds anything in the 1950-2017 observed record every other year under 1.5C of warming – or in two of every three years under 2C.
Human influence on European climate
There has been a substantial amount of work showing that recent heatwaves and hot summers in Europe have been strongly influenced by human-caused climate change.
This includes the very first “event attribution” study that made a direct connection between human-caused climate change and Europe’s record hot summer of 2003. As a densely populated continent, recent hot summers and heatwaves have hit Europe with spikes in mortality rates.
Europe is also a particularly good location to study the implications of the Paris Agreement limits because it has among the longest and highest quality climate data in the world. This means we have a better understanding of what past summers in Europe have been like and we can evaluate our climate model simulations with a higher degree of confidence, relative to other regions of the world.
In our study, we looked at the hottest average summer temperatures across Europe since 1950 and found that for most of the continent these occurred in 2003, 2006 or 2010. There are exceptions, of course. For example, in Central England the hottest summer remains 1976.
You can see this in the graphic below, which maps the decade of the hottest summer across Europe. The darker the shading, the more recently the record occurred.
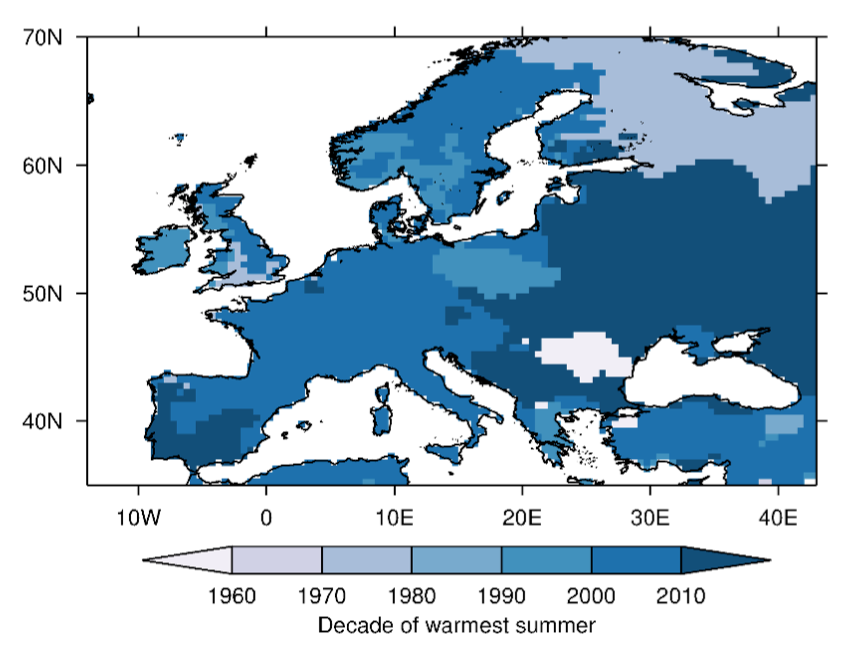
Map showing decade of warmest summer on record (since 1950). The darker shading shows more recent decades. Source: King et al. (2018)
Using the historical record hot summer between 1950 and 2017 in each location in Europe as a benchmark, we then examined the likelihood of a summer exceeding that record in model simulations. We assessed four different scenarios: a world without climate change, the world of today’s climate, a 1.5C warmer world and a 2C warmer world.
Consistent with previous studies, which have examined specific heat events in Europe like those in 2003 and 2010, we found that the likelihood of recording a new hottest summer today is higher than in a world without human-induced climate change.
Similarly, when we extend our analysis to the 1.5C and 2C world simulations, we find a continued increase in the likelihood of historically unprecedented hot summers at individual locations across all of Europe.
The impact on humans
Our next step was to estimate how many people would be exposed to historically unprecedented summer average temperatures in each of our four model worlds. For this analysis we kept population levels the same (at the 2010 level), rather than factoring in historical changes or future forecasts.
We found systematic increases in the number of people in Europe projected to experience unprecedented summer heat.
In a typical summer in the current climate, we would expect that 45 million Europeans would experience summer temperatures above the existing record for their location. However, in an average summer in a 1.5C world, we project that 90 million Europeans – about 11% of the continent’s population – would experience a summer warmer than any in recorded history. In a 2C world this figure would almost double again to 163 million Europeans (20% of the population).
We also find that the possibility of very high population exposure to historically unprecedented hot summers increases dramatically from the world of today to a 1.5C world or a 2C world.
The table below shows the likelihood of seeing a summer where 100-400 million Europeans experience a record summer in each of the four model worlds. You can see that more than 100 million Europeans (top row) will typically see unprecedented summer heat every other year under 1.5C of warming – or in two of every three years under 2C.
And while there is a negligible likelihood of seeing a summer where more than 400 million Europeans (bottom row) experience a new record hot summer under pre-industrial conditions or in the current climate. Yet in a 2C world, we project this would happen roughly every seven years.
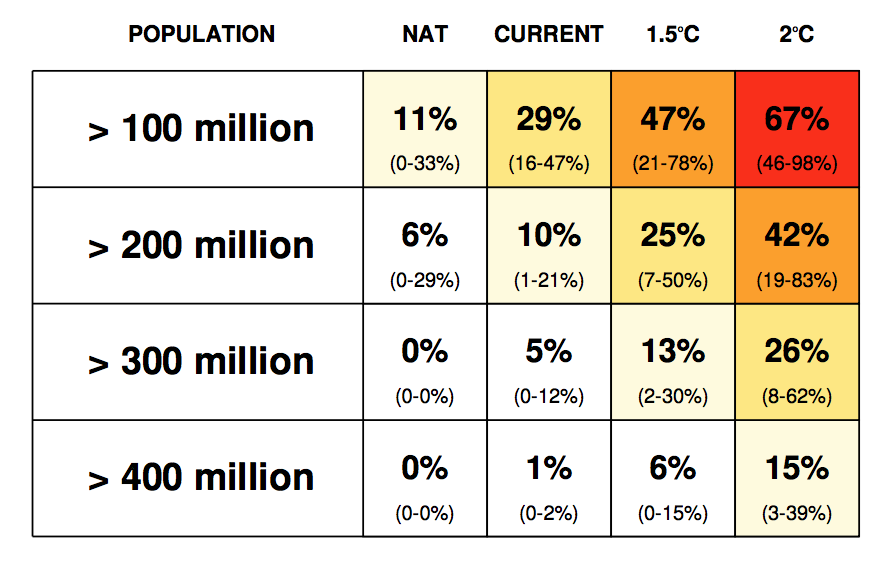
The table shows the likelihood in a given year of a summer where more than 100, 200, 300 and 400 million people experience a summer beyond the observed record. Numbers in parentheses show 90% confidence intervals and redder colours indicate increased likelihood. Source: King et al. (2018)
Benefits of climate action
Our analysis illustrates that in a 2C world Europeans would experience more frequent and intense heat extremes than in a 1.5C world.
Despite the fact that restricting global warming would benefit the world’s poorest more than others, our study shows that for Europe specifically, taking stronger action to reduce greenhouse gas emissions need not be a purely selfless act. The countries and peoples of Europe, especially those in southern Europe which have borne the brunt of recent heatwaves and hot summers, would benefit from reduced exposure to heat extremes if the 1.5C Paris limit is met as opposed to the 2C global warming limit.
European emissions pledges are currently rated as inadequate in reaching either the 1.5C or 2C Paris targets. Our study strongly supports progressively more ambitious reductions to be proposed at the periodic stocktakes, the first of which will probably be in 2023.
While European countries are taking stronger action to curb emissions compared to many other developed nations, it is in Europe’s own interests to maintain and strengthen these pledges.
King, A. D. et al. (2018) Reduced Heat Exposure by Limiting Global Warming to 1.5C, Nature Climate Change, doi:10.1038/s41558-018-0191-0
from Skeptical Science https://ift.tt/2wuDlmo
This is a re-post from Carbon Brief. Dr Andrew King is a climate scientist at the University of Melbourne and Dr Markus Donat is a climate scientist at the University of New South Wales
As summer gets underway in the northern hemisphere, much of Europe has already been basking in temperatures of 30C and beyond.
But while the summer sun sends many flocking to the beach, with it comes the threat of heatwaves and their potentially deadly impacts. Tens of thousands of people across Europe died in heatwaves in 2003 and 2010, for example, while the “Lucifer” heatwave last year fanned forest fires and nearly halved agricultural output in some countries.
With international ambition to limit global temperature rise to “well below” 2C above pre-industrial levels now enshrined in the Paris Agreement, we have examined what impact that warming could have on European summer temperatures.
Our results, published today in Nature Climate Change, find that more than 100 million Europeans will typically see summer heat that exceeds anything in the 1950-2017 observed record every other year under 1.5C of warming – or in two of every three years under 2C.
Human influence on European climate
There has been a substantial amount of work showing that recent heatwaves and hot summers in Europe have been strongly influenced by human-caused climate change.
This includes the very first “event attribution” study that made a direct connection between human-caused climate change and Europe’s record hot summer of 2003. As a densely populated continent, recent hot summers and heatwaves have hit Europe with spikes in mortality rates.
Europe is also a particularly good location to study the implications of the Paris Agreement limits because it has among the longest and highest quality climate data in the world. This means we have a better understanding of what past summers in Europe have been like and we can evaluate our climate model simulations with a higher degree of confidence, relative to other regions of the world.
In our study, we looked at the hottest average summer temperatures across Europe since 1950 and found that for most of the continent these occurred in 2003, 2006 or 2010. There are exceptions, of course. For example, in Central England the hottest summer remains 1976.
You can see this in the graphic below, which maps the decade of the hottest summer across Europe. The darker the shading, the more recently the record occurred.
Map showing decade of warmest summer on record (since 1950). The darker shading shows more recent decades. Source: King et al. (2018)
Using the historical record hot summer between 1950 and 2017 in each location in Europe as a benchmark, we then examined the likelihood of a summer exceeding that record in model simulations. We assessed four different scenarios: a world without climate change, the world of today’s climate, a 1.5C warmer world and a 2C warmer world.
Consistent with previous studies, which have examined specific heat events in Europe like those in 2003 and 2010, we found that the likelihood of recording a new hottest summer today is higher than in a world without human-induced climate change.
Similarly, when we extend our analysis to the 1.5C and 2C world simulations, we find a continued increase in the likelihood of historically unprecedented hot summers at individual locations across all of Europe.
The impact on humans
Our next step was to estimate how many people would be exposed to historically unprecedented summer average temperatures in each of our four model worlds. For this analysis we kept population levels the same (at the 2010 level), rather than factoring in historical changes or future forecasts.
We found systematic increases in the number of people in Europe projected to experience unprecedented summer heat.
In a typical summer in the current climate, we would expect that 45 million Europeans would experience summer temperatures above the existing record for their location. However, in an average summer in a 1.5C world, we project that 90 million Europeans – about 11% of the continent’s population – would experience a summer warmer than any in recorded history. In a 2C world this figure would almost double again to 163 million Europeans (20% of the population).
We also find that the possibility of very high population exposure to historically unprecedented hot summers increases dramatically from the world of today to a 1.5C world or a 2C world.
The table below shows the likelihood of seeing a summer where 100-400 million Europeans experience a record summer in each of the four model worlds. You can see that more than 100 million Europeans (top row) will typically see unprecedented summer heat every other year under 1.5C of warming – or in two of every three years under 2C.
And while there is a negligible likelihood of seeing a summer where more than 400 million Europeans (bottom row) experience a new record hot summer under pre-industrial conditions or in the current climate. Yet in a 2C world, we project this would happen roughly every seven years.
The table shows the likelihood in a given year of a summer where more than 100, 200, 300 and 400 million people experience a summer beyond the observed record. Numbers in parentheses show 90% confidence intervals and redder colours indicate increased likelihood. Source: King et al. (2018)
Benefits of climate action
Our analysis illustrates that in a 2C world Europeans would experience more frequent and intense heat extremes than in a 1.5C world.
Despite the fact that restricting global warming would benefit the world’s poorest more than others, our study shows that for Europe specifically, taking stronger action to reduce greenhouse gas emissions need not be a purely selfless act. The countries and peoples of Europe, especially those in southern Europe which have borne the brunt of recent heatwaves and hot summers, would benefit from reduced exposure to heat extremes if the 1.5C Paris limit is met as opposed to the 2C global warming limit.
European emissions pledges are currently rated as inadequate in reaching either the 1.5C or 2C Paris targets. Our study strongly supports progressively more ambitious reductions to be proposed at the periodic stocktakes, the first of which will probably be in 2023.
While European countries are taking stronger action to curb emissions compared to many other developed nations, it is in Europe’s own interests to maintain and strengthen these pledges.
King, A. D. et al. (2018) Reduced Heat Exposure by Limiting Global Warming to 1.5C, Nature Climate Change, doi:10.1038/s41558-018-0191-0
from Skeptical Science https://ift.tt/2wuDlmo