

Image via Lynton Brown.
from EarthSky https://ift.tt/2Mtizdk

It’s Cervical Screening Awareness week, which we’ve been supporting across our social media channels. One tweet sparked debate around the inclusive language we selected, which led journalists to cover the discussions on Twitter. Some people were against our choice, others were supportive.
We’re only half way through June and children in England have already consumed more than the recommended daily intake of sugar for 2018, according to Public Health England. The BBC and the Guardian say kids in England are consuming twice the amount of sugar that is recommended each year and are on track to consume on average 4,800 cubes of sugar by the end of 2018. The survey suggests sugary drinks and sweet treats like cakes are largely to blame.
Scientists in London said they are planning a trial that would look for DNA faults in men’s saliva as a possible way to gauge their risk of prostate cancer. The plans are based on a study that uncovered new gene faults linked to risk, reports the BBC.
Cancer Research UK is collaborating with a company called Asterias Biotherapeutics to set up a trial testing a vaccine for a certain type of lung cancer. The early-stage trial largely aims to see if the vaccine is safe, reports PharmaTimes. Our press release explains how the vaccine works.
Scientists found that genome editing with CRISPR is more likely to work in cells without a gene that’s often also lost in cancer cells, called p53. STAT News said this points to the potential for the technology to generate cells that, if they were given to someone as a treatment, might seed the growth of tumours. After plenty of discussion online, this follow-up piece answered some questions and reinforced how much more research is needed on this emerging technology before it could be used to treat diseases.
An international study has looked at the link between vitamin D and bowel cancer risk. The study looked at vitamin D levels in over 12,500 people. They reported that people with a vitamin D deficiency had a 31% higher risk of developing bowel cancer than those with sufficient levels. But we still need more research to confirm whether this is a real link, or whether people with vitamin D deficiency are just more unhealthy in general. The Mail Online covered this one.
The Guardian explores the potential ways in which artificial intelligence (AI) could help the NHS. This piece came from a new report, by the former health minister Lord Darzi and the think tank IPPR. The report suggests that robots could soon help hospital staff with a range of tasks, including helping patients eat their meals, diagnosing serious illnesses and even helping people recover from operations.
Gabi
A selection of new climate related research articles is shown below.
Mankind
The Inequality of Climate Change From 1.5 to 2°C of Global Warming (open access)
"The Paris Agreement aims to keep global warming well below 2°C above preindustrial levels with a preferred ambitious 1.5°C target. Developing countries, especially small island nations, pressed for the 1.5°C target to be adopted, but who will suffer the largest changes in climate if we miss this target? Here we show that exceeding the 1.5°C global warming target would lead to the poorest experiencing the greatest local climate changes. Under these circumstances greater support for climate adaptation to prevent poverty growth would be required."
Short-term effect of tropospheric ozone on daily mortality in Spain
Indicators of climate change in agricultural systems (open access)
The role of scientific expertise in local adaptation to projected sea level rise (open access)
Managing the risk of extreme climate events in Australian major wheat production systems
Comparing impacts of climate change and mitigation on global agriculture by 2050 (open access)
Strategic adaptation pathway planning to manage sea-level rise and changing coastal flood risk
Predicting shifting sustainability trade‐offs in marine finfish aquaculture under climate change
Biosphere
"Under present temperature (17°C) and level of parasitism, the parasite had little impact on the host community. However, elevating the temperature to 21°C in the presence of parasites induced massive structural changes: amphipod abundances decreased species‐specifically, affecting epibenthic species but leaving infaunal species largely untouched. In effect, species diversity dropped significantly. In contrast, four degree higher temperatures in the absence of parasitism had limited influence on the amphipod community."
Carbon assimilation and transfer through kelp forests in the NE Atlantic is diminished under a warmer ocean climate (open access)
Effects of climate legacies on above‐ and belowground community assembly
Large‐scale prerain vegetation green‐up across Africa
The effect of warmer winters on the demography of an outbreak insect is hidden by intraspecific competition (open access)
Other impacts
Climate Change Amplifications of Climate‐Fire Teleconnections in the Southern Hemisphere
Ratcheting ambition to limit warming to 1.5 °C–trade-offs between emission reductions and carbon dioxide removal (open access)
Climate change communication
Does risk communication really decrease cooperation in climate change mitigation? (open acces)
Being Skeptical? Exploring Far-Right Climate-Change Communication in Germany
Emission savings
Remote assessment of extracted volumes and greenhouse gases from tropical timber harvest (open access)
Environmental impact of meal service catering for dependent senior citizens in Danish municipalities (open access)
Energy production
Assessing the evolution of power sector carbon intensity in the United States (open access)
Potential of solar energy in Iran for carbon dioxide mitigation
Climate Policy
India in 2 °C and well below 2 °C worlds: Opportunities and challenges
Decision making under uncertainty in climate change mitigation: introducing multiple actor motivations, agency and influence (open access)
Does global warming amplify interannual climate variability?
Regional and Seasonal Characteristics of the Recent Expansion of the Tropics
On the need for regional climate information over Africa under varying levels of global warming (open access)
Temperature, precipitation, wind
Elevation-dependent warming in global climate model simulations at high spatial resolution (open access)
Internal variability in European summer temperatures at 1.5 °C and 2 °C of global warming (open access)
Diversity in global patterns of observed precipitation variability and change on river basin scales
Robust changes in tropical rainy season length at 1.5 °C and 2 °C (open access)
"Specifically, we report a robust shortening of the rainy season for all of tropical Africa as well as north-east Brazil. About 27% of West Africa is projected to experience robust changes in the rainy season length with a mean shortening of about 7 days under 1.5 °C."
Temperature extremes in Alaska: temporal variability and circulation background (open access)
Extreme events
Predictability of the European heat and cold waves (open access)
Risk and dynamics of unprecedented hot months in South East China
CMIP5 Projected Change in Northern Hemisphere Winter Cyclones with Associated Extreme Winds
Forcings and feedbacks
Radiative Feedbacks From Stochastic Variability in Surface Temperature and Radiative Imbalance
Future changes in the stratosphere-to-troposphere ozone mass flux and the contribution from climate change and ozone recovery (open access)
Spring snow albedo feedback over northern Eurasia: Comparing in situ measurements with reanalysis products (open access)
Understanding the role of sea surface temperature-forcing for variability in global temperature and precipitation extremes (open access)
Cryosphere
Decadal variability of Great Lakes ice cover in response to AMO and PDO, 1963-2017 (open access)
Snow depth on Arctic sea ice from historical in situ data (open access)
Contributions of Ice Thickness to the Atmospheric Response From Projected Arctic Sea Ice Loss
Dynamic Response of a High Arctic Glacier to Melt and Runoff Variations
Reflective properties of melt ponds on sea ice (open access)
Hydrosphere
Relative Sea Level, Tides, and Extreme Water Levels in Boston Harbor From 1825 to 2018
Atmospheric and oceanic circulation
Carbon cycle
Increasing Methane Emissions From Natural Land Ecosystems due to Sea‐Level Rise
Temperature response of permafrost soil carbon is attenuated by mineral protection
Influence of high-latitude warming and land-use changes in the early 20th century northern Eurasian CO2 sink (open access)
Potential strong contribution of future anthropogenic land-use and land-cover change to the terrestrial carbon cycle (open access)
Palaeoclimatology
The importance of snow albedo for ice sheet evolution over the last glacial cycle (open access)

Last week, we launched our Shoulder to Shoulder Against Cancer Campaign to push for the Government to train and employ more staff to diagnose and treat cancers earlier. Over 80 voluntary Cancer Campaigns Ambassadors went to Parliament to meet their MPs and ask them to sign a joint letter to the Prime Minister.
Cancer survivor and Campaigns Ambassador Elizabeth Bailey spoke at the event. Here, she explains why she’s supporting the campaign, and how you can get involved.

Elizabeth at the campaign launch.
This time 8 years ago, I was nearing the end of gruelling surgery and chemotherapy, and approaching radiotherapy.
Some months earlier, I had sat in the car park of the Luton and Dunstable hospital and cried aching tears. Diagnosed with a large breast cancer that had spread to nearby lymph nodes, I thought I had no through road ahead, and I would be leaving my two beautiful daughters before they grew up.
But I’m still here and I’m quite noisy thanks to our NHS staff.
For my cancer care, from diagnosis to treatment, I have many NHS staff to thank. They are the reason I can be a mother today for my children. Our NHS is there when we’re at our most fearful and vulnerable, and now it’s time to stand with them.
Screening, testing and treating cancer effectively takes time and people. Having benefited from radiotherapy myself, I know that 4 in 10 cancer patients will receive radiotherapy for their treatment. Yet there is a shortage of therapeutic radiotherapists to do this essential job.
I’ve been told there’s a medium to high risk of the cancer coming back because of its stage of advancement. I do go back to hospital quite often for various checks, and I do sadly experience delays in my appointments because of the shortages.
This is a political matter, but it’s not a party-political one. It’s not about polarisation of opinion, or taking sides. It’s about us all standing shoulder to shoulder, and giving this problem the resources it needs.
So, I am asking you, play your part in making this happen, and stand shoulder to shoulder with me against cancer.
Elizabeth
Right now, the NHS is stretched. Across the UK, 1 in 10 positions for diagnostic staff are vacant. And with an ageing and growing population, the demand for tests and treatment is increasing.
There have been positive steps, including yesterday’s Government announcement to remove immigration restrictions for non-EU doctors. But the NHS needs long-term solutions, including more funding to train and recruit staff to diagnose and treat cancer. The UK Government has promised a spending review to look at what the NHS needs now and in the future. This review must address the NHS workforce crisis.
110 MPs and Peers have backed our campaign so far, but we need more. Your MP’s support will help make early diagnosis of cancer and the NHS workforce a priority in long-term funding plans.
Join Elizabeth and other cancer campaigners today.
Kirsten Rhodes is a campaigning officer at Cancer Research UK
Last week, we launched our Shoulder to Shoulder Against Cancer Campaign to push for the Government to train and employ more staff to diagnose and treat cancers earlier. Over 80 voluntary Cancer Campaigns Ambassadors went to Parliament to meet their MPs and ask them to sign a joint letter to the Prime Minister.
Cancer survivor and Campaigns Ambassador Elizabeth Bailey spoke at the event. Here, she explains why she’s supporting the campaign, and how you can get involved.
Elizabeth at the campaign launch.
This time 8 years ago, I was nearing the end of gruelling surgery and chemotherapy, and approaching radiotherapy.
Some months earlier, I had sat in the car park of the Luton and Dunstable hospital and cried aching tears. Diagnosed with a large breast cancer that had spread to nearby lymph nodes, I thought I had no through road ahead, and I would be leaving my two beautiful daughters before they grew up.
But I’m still here and I’m quite noisy thanks to our NHS staff.
For my cancer care, from diagnosis to treatment, I have many NHS staff to thank. They are the reason I can be a mother today for my children. Our NHS is there when we’re at our most fearful and vulnerable, and now it’s time to stand with them.
Screening, testing and treating cancer effectively takes time and people. Having benefited from radiotherapy myself, I know that 4 in 10 cancer patients will receive radiotherapy for their treatment. Yet there is a shortage of therapeutic radiotherapists to do this essential job.
I’ve been told there’s a medium to high risk of the cancer coming back because of its stage of advancement. I do go back to hospital quite often for various checks, and I do sadly experience delays in my appointments because of the shortages.
This is a political matter, but it’s not a party-political one. It’s not about polarisation of opinion, or taking sides. It’s about us all standing shoulder to shoulder, and giving this problem the resources it needs.
So, I am asking you, play your part in making this happen, and stand shoulder to shoulder with me against cancer.
Elizabeth
Right now, the NHS is stretched. Across the UK, 1 in 10 positions for diagnostic staff are vacant. And with an ageing and growing population, the demand for tests and treatment is increasing.
There have been positive steps, including yesterday’s Government announcement to remove immigration restrictions for non-EU doctors. But the NHS needs long-term solutions, including more funding to train and recruit staff to diagnose and treat cancer. The UK Government has promised a spending review to look at what the NHS needs now and in the future. This review must address the NHS workforce crisis.
110 MPs and Peers have backed our campaign so far, but we need more. Your MP’s support will help make early diagnosis of cancer and the NHS workforce a priority in long-term funding plans.
Join Elizabeth and other cancer campaigners today.
Kirsten Rhodes is a campaigning officer at Cancer Research UK


Changes in the Antarctic ice sheet’s contribution to global sea level, 1992 to 2017. Image via IMBIE/Planetary Visions/NASA JPL.
Scientists in the U.S. and Europe reported this week (June 13, 2018) on what they said what the most robust assessment to date of ice loss in Antarctica and its contribution to global sea level rise. The assessment – funded by NASA and the European Space Agency (ESA) – combines 24 satellite surveys of Antarctica and involves 80 scientists from 42 international organizations. Its results are that ice losses from Antarctica are moving at a faster rate now, with the rate tripling since 2012. The result has been that global sea levels have risen by 0.12 inch (3 millimeters) in that timeframe alone. A statement from NASA said:
According to the study, ice losses from Antarctica are causing sea levels to rise faster today than at any time in the past 25 years.
The peer-reviewed journal Nature published the recent results of the Ice Sheet Mass Balance Inter-comparison Exercise (IMBIE) on June 13.

View larger. | The late summer sun sets over mountains and icebergs around Adelaide Island, Antarctic Peninsula, as 24-hour daylight gives way to the long polar night of winter. Image via Hamish Pritchard, BAS/ NASA JPL.
Assessment team co-lead Erik Ivins at NASA’s Jet Propulsion Laboratory in Pasadena, California, said:
This is the most robust study of the ice mass balance of Antarctica to date. It covers a longer period than our 2012 IMBIE study, has a larger pool of participants and incorporates refinements in our observing capability and an improved ability to assess uncertainties.
NASA said:
The team looked at the mass balance of the Antarctic ice sheet from 1992 to 2017 and found ice losses from Antarctica raised global sea levels by 0.3 inches (7.6 millimeters), with a sharp uptick in ice loss in recent years. They attribute the threefold increase in ice loss from the continent since 2012 to a combination of increased rates of ice melt in West Antarctica and the Antarctic Peninsula, and reduced growth of the East Antarctic ice sheet.
Prior to 2012, ice was lost at a steady rate of about 83.8 billion tons (76 billion metric tons) per year, contributing about 0.008 inches (0.2 millimeters) a year to sea level rise. Since 2012, the amount of ice loss per year has tripled to 241.4 billion tons (219 billion metric tonnes) — equivalent to about 0.02 inches per year (0.6 millimeters) of sea level rise.
West Antarctica experienced the greatest recent change, with ice loss rising from 58.4 billion tons (53 billion metric tons) per year in the 1990s, to 175.3 billion tons (159 billion metric tons) a year since 2012. Most of this loss came from the huge Pine Island and Thwaites glaciers, which are retreating rapidly due to ocean-induced melting.
At the northern tip of the continent, ice-shelf collapse at the Antarctic Peninsula has driven an increase of 27.6 billion tons (25 billion metric tons) in ice loss per year since the early 2000s. Meanwhile, the team found the East Antarctic ice sheet has remained relatively balanced during the past 25 years, gaining an average of 5.5 billion tons (5 billion metric tons) of ice per year.
Antarctica’s potential contribution to global sea level rise from its land-held ice is almost 7.5 times greater than all other sources of land-held ice in the world combined. The continent stores enough frozen water to raise global sea levels by 190 feet (58 meters), if it were to melt entirely.
Knowing how much ice it’s losing is key to understanding the impacts of climate change now and its pace in the future.
Read more about the new assessment from NASA
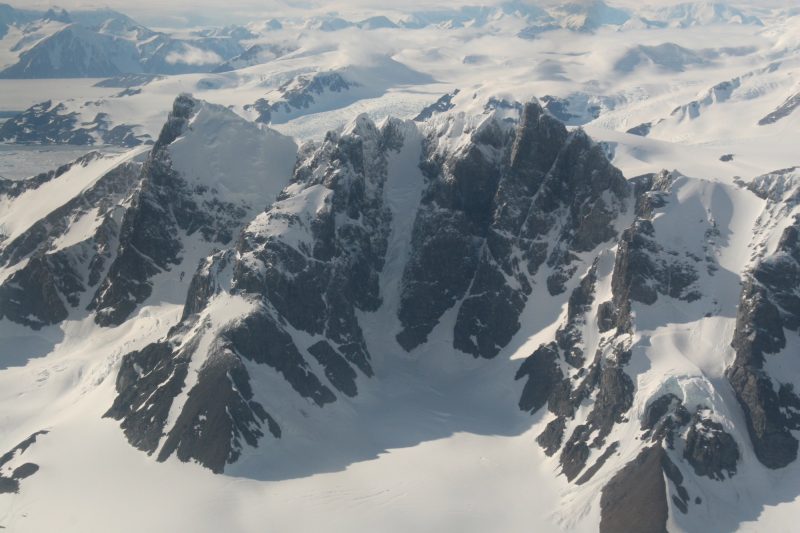
The Antarctic Peninsula from the air: although the mountains are plastered in snow and ice, measurements tell us that this region is losing ice at an increasing rate. Image via Pippa Whitehouse, University of Durham/ NASA JPL.
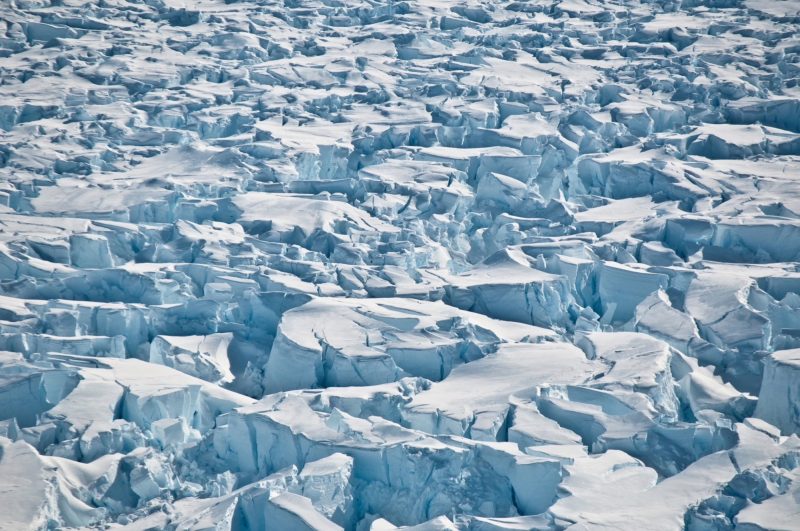
Crevasses near the grounding line of Pine Island Glacier, Antarctica. Image via I. Joughin, University of Washington/ NASA JPL.
Bottom line: A new assessment – combining 24 satellite surveys of Antarctica and involves 80 scientists from 42 international organizations – show that ice losses from Antarctica are moving at a faster rate now, with the rate tripling since 2012.
Changes in the Antarctic ice sheet’s contribution to global sea level, 1992 to 2017. Image via IMBIE/Planetary Visions/NASA JPL.
Scientists in the U.S. and Europe reported this week (June 13, 2018) on what they said what the most robust assessment to date of ice loss in Antarctica and its contribution to global sea level rise. The assessment – funded by NASA and the European Space Agency (ESA) – combines 24 satellite surveys of Antarctica and involves 80 scientists from 42 international organizations. Its results are that ice losses from Antarctica are moving at a faster rate now, with the rate tripling since 2012. The result has been that global sea levels have risen by 0.12 inch (3 millimeters) in that timeframe alone. A statement from NASA said:
According to the study, ice losses from Antarctica are causing sea levels to rise faster today than at any time in the past 25 years.
The peer-reviewed journal Nature published the recent results of the Ice Sheet Mass Balance Inter-comparison Exercise (IMBIE) on June 13.
View larger. | The late summer sun sets over mountains and icebergs around Adelaide Island, Antarctic Peninsula, as 24-hour daylight gives way to the long polar night of winter. Image via Hamish Pritchard, BAS/ NASA JPL.
Assessment team co-lead Erik Ivins at NASA’s Jet Propulsion Laboratory in Pasadena, California, said:
This is the most robust study of the ice mass balance of Antarctica to date. It covers a longer period than our 2012 IMBIE study, has a larger pool of participants and incorporates refinements in our observing capability and an improved ability to assess uncertainties.
NASA said:
The team looked at the mass balance of the Antarctic ice sheet from 1992 to 2017 and found ice losses from Antarctica raised global sea levels by 0.3 inches (7.6 millimeters), with a sharp uptick in ice loss in recent years. They attribute the threefold increase in ice loss from the continent since 2012 to a combination of increased rates of ice melt in West Antarctica and the Antarctic Peninsula, and reduced growth of the East Antarctic ice sheet.
Prior to 2012, ice was lost at a steady rate of about 83.8 billion tons (76 billion metric tons) per year, contributing about 0.008 inches (0.2 millimeters) a year to sea level rise. Since 2012, the amount of ice loss per year has tripled to 241.4 billion tons (219 billion metric tonnes) — equivalent to about 0.02 inches per year (0.6 millimeters) of sea level rise.
West Antarctica experienced the greatest recent change, with ice loss rising from 58.4 billion tons (53 billion metric tons) per year in the 1990s, to 175.3 billion tons (159 billion metric tons) a year since 2012. Most of this loss came from the huge Pine Island and Thwaites glaciers, which are retreating rapidly due to ocean-induced melting.
At the northern tip of the continent, ice-shelf collapse at the Antarctic Peninsula has driven an increase of 27.6 billion tons (25 billion metric tons) in ice loss per year since the early 2000s. Meanwhile, the team found the East Antarctic ice sheet has remained relatively balanced during the past 25 years, gaining an average of 5.5 billion tons (5 billion metric tons) of ice per year.
Antarctica’s potential contribution to global sea level rise from its land-held ice is almost 7.5 times greater than all other sources of land-held ice in the world combined. The continent stores enough frozen water to raise global sea levels by 190 feet (58 meters), if it were to melt entirely.
Knowing how much ice it’s losing is key to understanding the impacts of climate change now and its pace in the future.
Read more about the new assessment from NASA
The Antarctic Peninsula from the air: although the mountains are plastered in snow and ice, measurements tell us that this region is losing ice at an increasing rate. Image via Pippa Whitehouse, University of Durham/ NASA JPL.
Crevasses near the grounding line of Pine Island Glacier, Antarctica. Image via I. Joughin, University of Washington/ NASA JPL.
Bottom line: A new assessment – combining 24 satellite surveys of Antarctica and involves 80 scientists from 42 international organizations – show that ice losses from Antarctica are moving at a faster rate now, with the rate tripling since 2012.

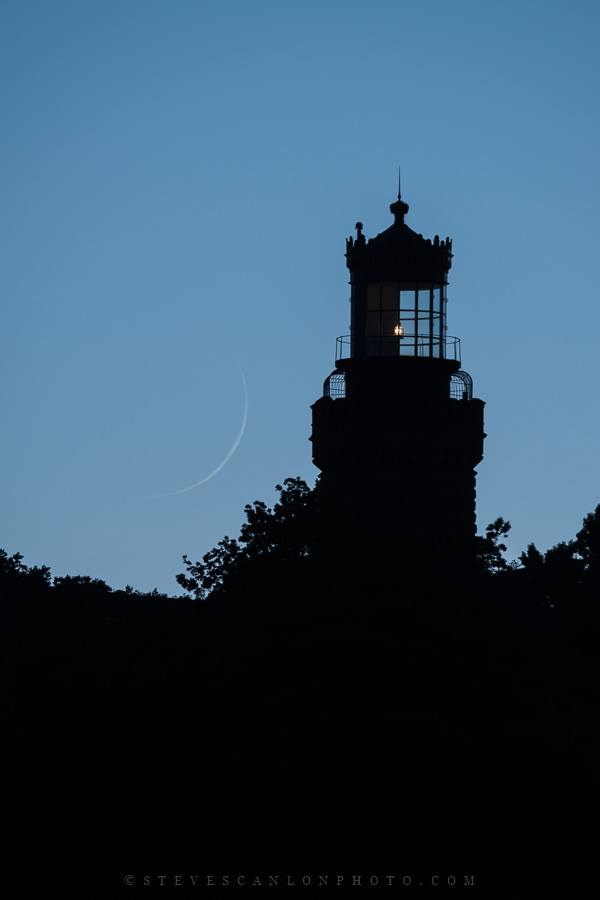
Steve Scanlon Photography wrote on June 14, 2018: “This evening’s hard-to-catch sight: an extremely young moon setting over the Twin Lights of Navesink, Highlands, New Jersey. (2.2% illumination).”
The moon has returned to the evening sky now. You’re likely to see it in the coming evenings. Astronomers call it a young moon – a waxing crescent – when the moon appears in the west shortly after sunset.
The moon was possible to see from all of North America last night, but very think and tough to see from the U.S. East Coast.

View larger. | Gowrishankar Lakshminarayanan in New York City wrote: “A single exposure shot of the 2% waxing crescent resting in between the El Dorado towers was almost impossible to locate with bare eyes. If you see between the two towers there’s a tiny sliver of crescent moon almost bleached by the twilight after just half-hour after sun set.”
As Earth spun under the sky yesterday evening, the moon was moving in its orbit, putting distance between itself and the sun on our sky’s dome. In other words, the moon was waxing larger. By the time Earth’s spin had brought the moon into view for California, the moon was a bit easier to see.
The June 14, 2018 moon was 32 hours old – that is, 32 hours from the time of new moon – when it passed over the west coast of North America. Here’s the 32-hour moon from Steve Lightstone, in Sacramento, California.
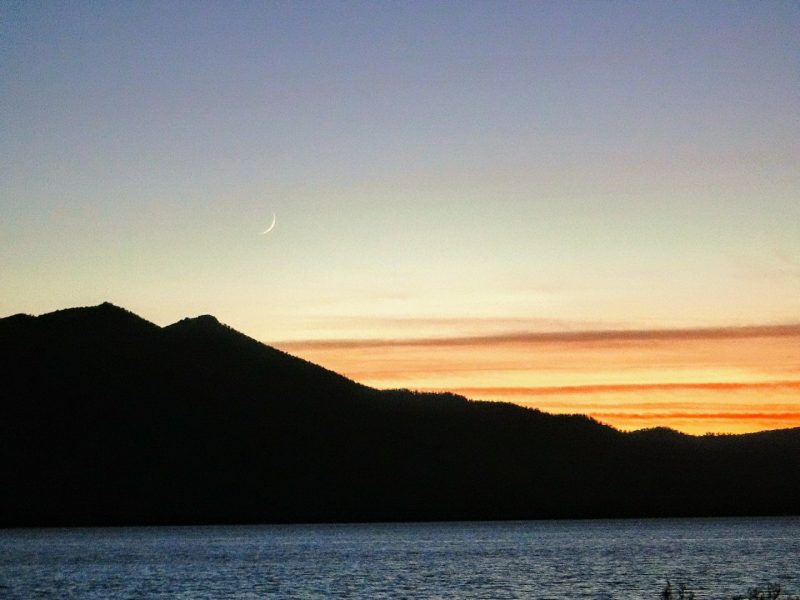
Young moon of June 14, 2018 via Luba Guvernator. I believe this photo is from around Lake Tahoe, in the Sierra Nevada Mountains, straddling the border of California and Nevada.
We received many photos of the moon on the evening of June 14. Submit your photo to EarthSky here.
Our friend Steven A. Sweet of Lunar 101 Moon Book posted the video below at EarthSky Facebook. Isn’t it cool?
Some people think a moon visible in the west after sunset is a rising moon. But it’s not; it’s a setting moon. All objects in our sky rise in the east and set in the west, due to Earth’s spin under the sky. When you see a waxing crescent, you know the Earth, moon and sun are located nearly on a line in space. If they were more precisely on a line, as they are at new moon, we wouldn’t see the moon. The moon would travel across the sky during the day, lost in the sun’s glare.
This week, for all of us around the globe, the waxing crescent moon is just off the Earth-sun line and so appears in the west after sunset.
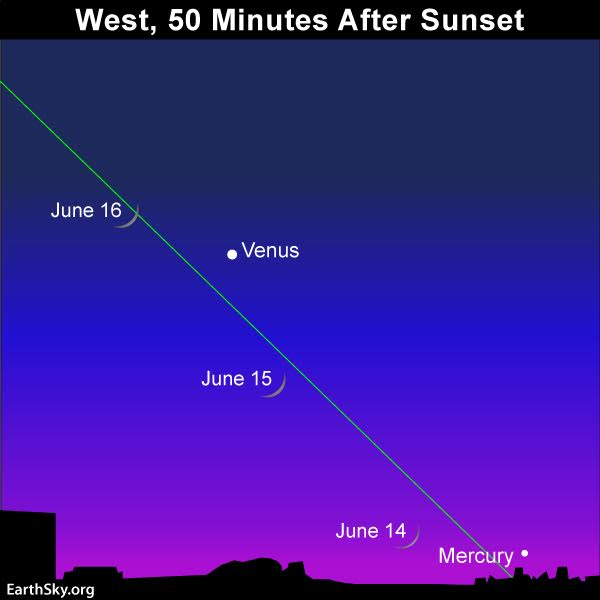
There are two planets in the west after sunset now, and the moon appears near them. The moon has already swept past the planet Mercury, which is now very low in the west after sunset. It’ll be passing Venus next. Watch for the moon and Venus on the evenings of June 15 and 16.
From the Americas, the young moon will return to the west after sunset on June 14. The bright starlike object in the part of the sky is the planet Venus.
By the way … a crescent moon has nothing to do with Earth’s shadow on the moon. The only time Earth’s shadow can fall on the moon is at full moon, during a lunar eclipse. There is a shadow on a crescent moon, but it’s the moon’s own shadow. Night on the moon happens on the part of the moon submerged in the moon’s own shadow. Likewise, night on Earth happens on the part of Earth submerged in Earth’s own shadow.
What many think is Earth’s shadow on a crescent moon is really something else. It’s earthshine, the pale glow on the darkened portion (night side) of a crescent moon. It’s caused by light reflected from Earth’s day side onto the moon. After all, when you see a crescent moon in Earth’s sky, any moon people looking back at our world would see a nearly full Earth. Read more: What is earthshine?
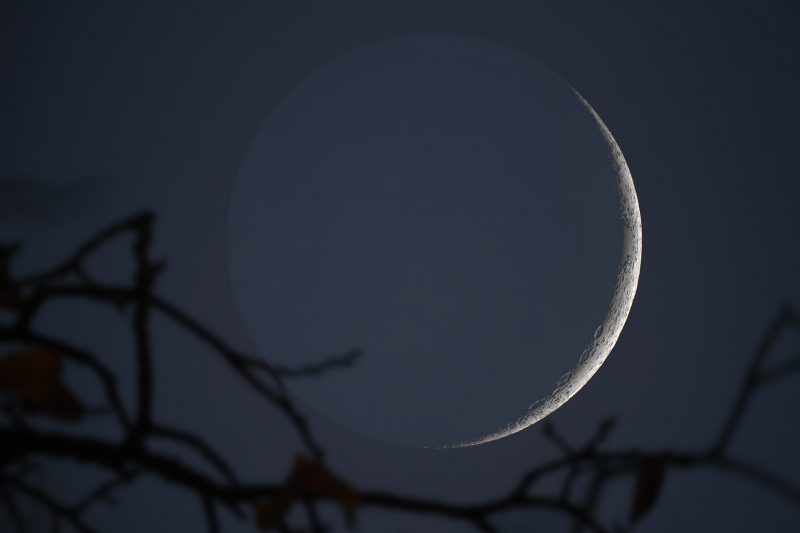
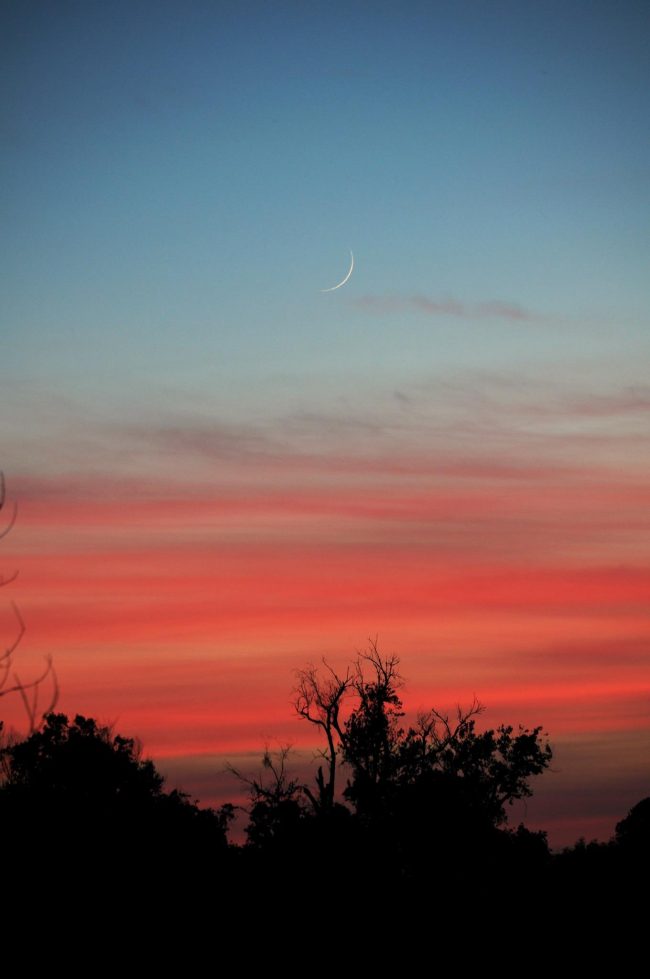
Earthshine on a crescent moon from Rob Pettengill of Austin, Texas.
Because the waxing crescent moon is nearly on a line with the Earth and sun, its illuminated hemisphere – or day side – is facing mostly away from us. We see only a slender fraction of the day side: a crescent moon. Each evening, because the moon is moving eastward in orbit around Earth, the moon appears farther from the sunset glare. It is moving farther from the Earth-sun line in space. Each evening, as the moon’s orbital motion carries it away from the Earth-sun line, we see more of the moon’s day side. Thus the crescent in the west after sunset appears to wax, or grow fatter each evening.
Bottom line: The June 2018 young moon has returned to the evening sky. Photos and video from the EarthSky community here.
Four keys to understanding moon phases
Check out EarthSky’s guide to the bright planets.
Steve Scanlon Photography wrote on June 14, 2018: “This evening’s hard-to-catch sight: an extremely young moon setting over the Twin Lights of Navesink, Highlands, New Jersey. (2.2% illumination).”
The moon has returned to the evening sky now. You’re likely to see it in the coming evenings. Astronomers call it a young moon – a waxing crescent – when the moon appears in the west shortly after sunset.
The moon was possible to see from all of North America last night, but very think and tough to see from the U.S. East Coast.
View larger. | Gowrishankar Lakshminarayanan in New York City wrote: “A single exposure shot of the 2% waxing crescent resting in between the El Dorado towers was almost impossible to locate with bare eyes. If you see between the two towers there’s a tiny sliver of crescent moon almost bleached by the twilight after just half-hour after sun set.”
As Earth spun under the sky yesterday evening, the moon was moving in its orbit, putting distance between itself and the sun on our sky’s dome. In other words, the moon was waxing larger. By the time Earth’s spin had brought the moon into view for California, the moon was a bit easier to see.
The June 14, 2018 moon was 32 hours old – that is, 32 hours from the time of new moon – when it passed over the west coast of North America. Here’s the 32-hour moon from Steve Lightstone, in Sacramento, California.
Young moon of June 14, 2018 via Luba Guvernator. I believe this photo is from around Lake Tahoe, in the Sierra Nevada Mountains, straddling the border of California and Nevada.
We received many photos of the moon on the evening of June 14. Submit your photo to EarthSky here.
Our friend Steven A. Sweet of Lunar 101 Moon Book posted the video below at EarthSky Facebook. Isn’t it cool?
Some people think a moon visible in the west after sunset is a rising moon. But it’s not; it’s a setting moon. All objects in our sky rise in the east and set in the west, due to Earth’s spin under the sky. When you see a waxing crescent, you know the Earth, moon and sun are located nearly on a line in space. If they were more precisely on a line, as they are at new moon, we wouldn’t see the moon. The moon would travel across the sky during the day, lost in the sun’s glare.
This week, for all of us around the globe, the waxing crescent moon is just off the Earth-sun line and so appears in the west after sunset.
There are two planets in the west after sunset now, and the moon appears near them. The moon has already swept past the planet Mercury, which is now very low in the west after sunset. It’ll be passing Venus next. Watch for the moon and Venus on the evenings of June 15 and 16.
From the Americas, the young moon will return to the west after sunset on June 14. The bright starlike object in the part of the sky is the planet Venus.
By the way … a crescent moon has nothing to do with Earth’s shadow on the moon. The only time Earth’s shadow can fall on the moon is at full moon, during a lunar eclipse. There is a shadow on a crescent moon, but it’s the moon’s own shadow. Night on the moon happens on the part of the moon submerged in the moon’s own shadow. Likewise, night on Earth happens on the part of Earth submerged in Earth’s own shadow.
What many think is Earth’s shadow on a crescent moon is really something else. It’s earthshine, the pale glow on the darkened portion (night side) of a crescent moon. It’s caused by light reflected from Earth’s day side onto the moon. After all, when you see a crescent moon in Earth’s sky, any moon people looking back at our world would see a nearly full Earth. Read more: What is earthshine?
Earthshine on a crescent moon from Rob Pettengill of Austin, Texas.
Because the waxing crescent moon is nearly on a line with the Earth and sun, its illuminated hemisphere – or day side – is facing mostly away from us. We see only a slender fraction of the day side: a crescent moon. Each evening, because the moon is moving eastward in orbit around Earth, the moon appears farther from the sunset glare. It is moving farther from the Earth-sun line in space. Each evening, as the moon’s orbital motion carries it away from the Earth-sun line, we see more of the moon’s day side. Thus the crescent in the west after sunset appears to wax, or grow fatter each evening.
Bottom line: The June 2018 young moon has returned to the evening sky. Photos and video from the EarthSky community here.
Four keys to understanding moon phases
Check out EarthSky’s guide to the bright planets.
Tar sands are the dirtiest fossil fuels. These are low-quality heavy tar-like oils that are mined from sand or rock. Much of the mining occurs in Alberta Canada, but it is also mined elsewhere, in lesser quantities.
Tar sands are the worst. Not only are they really hard to get out of the ground, requiring enormous amounts of energy; not only are they difficult to transport and to refine; not only are they more polluting than regular oils; they even have a by-product called ”petcoke” that’s used in power plants, but is dirtier than regular coal.
This stuff is worse than regular oil, worse than coal, worse than anything. Anyone who is serious about climate change cannot agree to mine and burn tar sands. To maintain climate change below critical thresholds, tar sands need to be left in the ground.
This fact is what motivated me to testify to the Minnesota Public Utilities Commission last November, to inform my state’s ruling commission about the impact of tar sands on the climate. Canadian energy company Enbridge has petitioned to put a pipeline through my state to carry this dirty tar to refining sites on the coast.
The proposed pipeline is called “Line 3.” The pipeline would carry approximately 760,000 barrels per day – the new pipeline would make it easier and cheaper for the oil companies to transport tar sands and consequently, would boost their bottom line. We already move over two million barrels per day through Minnesota in Enbridge pipelines. This new pipeline would encourage them to extract and sell more tar sands.
So, how much pollution would this pipeline carry? 170bn kilograms of carbon dioxide each year. The emissions are equal to approximately 50 coal power plants. These are huge numbers, but more importantly, approval of pipelines like this make it more likely that all of the tar sands in Alberta will be extracted. If that happens, global temperatures will increase by approximately 0.65°F (0.36°C). An astonishing number – approximately 3 decades worth of global warming.
If you care about climate change, then it is not logically possible to approve any pipeline or other infrastructure that may further worsen our climate. We are already screwing up the climate enough as it is.
The decision-making body in my state has heard climate arguments before. In fact, in 2016, the same body ruled against the coal giant Peabody. That ruling decided that fossil fuel companies low-balled the social cost of carbon. Back then, Peabody brought in a group of climate contrarians to argue their nonsense. My colleagues and I were able to convince the Commission that the facts were clear – we are causing climate change, and our decisions today can make tomorrow’s climate worse. This ruling was used when evaluating the social cost of carbon pollution for a new Line 3 pipeline. A judge found that emissions from this project would impose $287bn in social costs over 30 years.
In this case, the oil company Enbridge did not invite any contrarian climate scientists. They simply focused on arguments that a new pipeline will be safer to operate (fewer spills) and lessen other issues like rail traffic. They effectively conceded the climate arguments.
The decision will be revealed later this month. But already, an Administrative Law Judge has given a recommendation that the new pipeline be built, but in the exact same location as the current pipe. While this recommendation presents large costs to Enbridge, it completely misses the science. The judge’s opinion made no mention of climate change. How can a decision on extracting tar sands be made without considering climate effects?
Just last week, the staff of the commission also recommended construction of the new pipeline. They too omitted climate change from their decision.
I was proud to be able to stand alongside tomorrow’s leaders. Courageous youth became parties to the litigation and helped arrange the testimony of various climate experts like myself. One of the youth involved in the litigation, Frances Wetherall, summarized her view and told me why she was involved in the case.