When we think of global warming and climate change, most of us ignore the impacts that animals have on the environment. Climate affects animals, but is the reverse true? Can animals affect the climate?
I don’t know how to answer that question definitively, but I was fortunate enough to read a very recent paper from a top fluid dynamics research team from Stanford. The team, led by Dr. John Dabiri, is well known for their work on bio-inspired flow. Part of what they study is the influence of living organisms on fluid flow, especially flow of water in the oceans.
This team’s recent work deals with something called aggregate motion of swimmers and it was published in Nature this year. The researchers wanted to know what happens when thousands (or millions) of small creatures swim in a single direction. Can the wakes they create add up to a larger scale motion and can these motions affect the ocean waters that they swim through?
The team fabricated large tanks and filled them with water and Artemis salina (a species of brine shrimp). Using LED lights they were able to get the shrimp to swim upwards and downwards in the tank, replicating their daily vertical migrations. In the oceans, the vertical motion is hundreds of meters, but in the experiment, the shrimp swam upwards and downwards just a few meters.
Before the shrimp began their motion, the researchers measured the water stratification. That is, less dense water tends to rise to the top while heavier, more dense water sinks. In the oceans, as well as in experiments, the water density is dictated by its saltiness and the temperature.
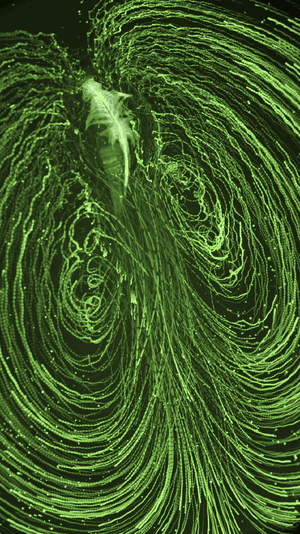
The authors discovered something amazing. After tricking the shrimp to swim upwards and downwards in the tank, the water stratification changed greatly. The shrimp brought heavier water upwards and lighter water downwards. While one or even a few hundred shrimp may not change the water structure, thousands of shrimp moving together can. A video of upward aggregate shrimp motion is shown here. Fluid motion from a single shrimp is shown here.
What the researchers also discovered was that shrimp, because they are dense, find it more difficult to swim upwards than downwards. Consequently, they have to create a strong propulsion jet when they swim upwards and virtually no propulsion jet when traveling downwards. Since these small propulsion jets are additive, shrimp cause much more mixing as they rise through the ocean waters compared to their descent. At the end of the day, the effect aggregate motion and turbulent mixing increased the normal mixing capacity of the water by a thousandfold.
I asked Dr. Dabiri about the importance of this project and he told me:
from Skeptical Science https://ift.tt/2JA7msS
When we think of global warming and climate change, most of us ignore the impacts that animals have on the environment. Climate affects animals, but is the reverse true? Can animals affect the climate?
I don’t know how to answer that question definitively, but I was fortunate enough to read a very recent paper from a top fluid dynamics research team from Stanford. The team, led by Dr. John Dabiri, is well known for their work on bio-inspired flow. Part of what they study is the influence of living organisms on fluid flow, especially flow of water in the oceans.
This team’s recent work deals with something called aggregate motion of swimmers and it was published in Nature this year. The researchers wanted to know what happens when thousands (or millions) of small creatures swim in a single direction. Can the wakes they create add up to a larger scale motion and can these motions affect the ocean waters that they swim through?
The team fabricated large tanks and filled them with water and Artemis salina (a species of brine shrimp). Using LED lights they were able to get the shrimp to swim upwards and downwards in the tank, replicating their daily vertical migrations. In the oceans, the vertical motion is hundreds of meters, but in the experiment, the shrimp swam upwards and downwards just a few meters.
Before the shrimp began their motion, the researchers measured the water stratification. That is, less dense water tends to rise to the top while heavier, more dense water sinks. In the oceans, as well as in experiments, the water density is dictated by its saltiness and the temperature.
The authors discovered something amazing. After tricking the shrimp to swim upwards and downwards in the tank, the water stratification changed greatly. The shrimp brought heavier water upwards and lighter water downwards. While one or even a few hundred shrimp may not change the water structure, thousands of shrimp moving together can. A video of upward aggregate shrimp motion is shown here. Fluid motion from a single shrimp is shown here.
What the researchers also discovered was that shrimp, because they are dense, find it more difficult to swim upwards than downwards. Consequently, they have to create a strong propulsion jet when they swim upwards and virtually no propulsion jet when traveling downwards. Since these small propulsion jets are additive, shrimp cause much more mixing as they rise through the ocean waters compared to their descent. At the end of the day, the effect aggregate motion and turbulent mixing increased the normal mixing capacity of the water by a thousandfold.
I asked Dr. Dabiri about the importance of this project and he told me:
from Skeptical Science https://ift.tt/2JA7msS