This week – on the night of May 8-9, 2018 – our planet Earth flies in between the sun and the outer planet Jupiter. That passage places Jupiter – largest world in our solar system, and a very bright planet in our sky – opposite the sun. In other words, Jupiter is now rising in the east as the sun is setting below the western horizon. Astronomers call this event an opposition of Jupiter.
Opposition marks the middle of the best time of year to see a planet. That’s because it’s when the planet is up all night and generally closest for the year (the exact date of Jupiter at its closest this year is May 10).
Your astronomical calendar for 2018 likely gives the date and time of Jupiter’s 2018 opposition as May 9 at 1 UTC. That translates to May 8 at 8 p.m. Central Daylight Time in North America (translate UTC to your time).

Jupiter (red) completes one orbit of the sun (center) for every 11.86 orbits of the Earth (blue). Our orbit is smaller, and we move faster! Animation via Wikimedia Commons.
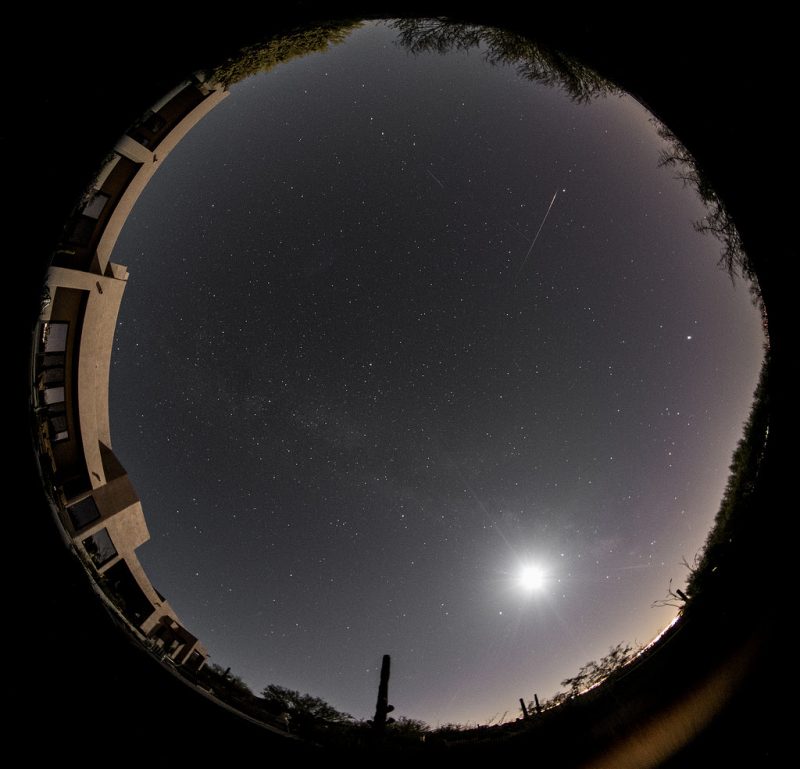
Rising in the east around sunset, Jupiter climbs highest in the sky at midnight. It sets in the west around sunrise. Jupiter is always bright; it’s the largest planet in our solar system. It shines more brightly than any star in the evening sky.
With the exception of the sun and moon, only Venus – the brightest planet, now in the west after sunset – outshines Jupiter. Try catching both Venus and Jupiter at nightfall now. Venus will be blazing low in the west and Jupiter, a bit fainter but still brighter than any star, will be shining in the east. Venus will set as Jupiter ascends in the eastern sky.
At this 2018 opposition, Jupiter shines in front of the constellation Libra the Scales. The close 2nd-magnitude star to Jupiter is Zubenelgenubi, Libra’s alpha star. Dazzling Jupiter – a planet in our own solar system, and therefore much closer to us – outshines this star by over 100 times.
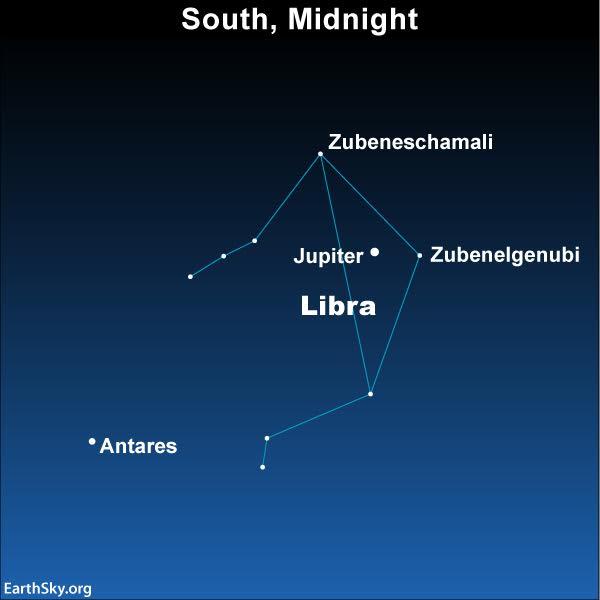
In any year, you can find the constellation Libra between the star Antares (to the east of Libra) and the star Spica (to the west of Libra, outside the chart). But in 2018, the planet Jupiter acts as your guide “star” to this fairly faint constellation. Northern Hemisphere viewers will find Jupiter and Libra in the south around midnight in May 2018. Southern Hemisphere viewers will find Jupiter and Libra closer to overhead at midnight.
Jupiter comes to opposition about every 13 months. That’s how long Earth takes to travel once around the sun relative to Jupiter. As a result – according to our earthly calendars – Jupiter’s opposition comes about a month later each year.
Last year – in 2017 – Jupiter’s opposition date was April 7.
Next year – in 2019 – it’ll be June 10.

Jupiter and its large moon Ganymede as captured on May 3, 2018 by Eric Bayne.
Jupiter is sometimes called a failed star. You would need at least 80 Jupiters – rolled into a ball – to be hot enough inside for thermonuclear reactions to ignite. In other words, Jupiter is not massive enough to shine as stars do.
But Jupiter is the largest and most massive planet in our solar system. So when the sun goes down on this May night, you might — if you’re fanciful enough — you might imagine bright Jupiter as a tiny sun all night long.
Bottom line: Be sure to look for Jupiter on the night of May 8-9, 2019 as this world reaches opposition, the point opposite the sun in our sky. About one and one-half day later, on May 10, at 12 UTC, Jupiter reaches its closest point to Earth for this year!
Donate: Your support means the world to us
from EarthSky https://ift.tt/1UuLm0p
This week – on the night of May 8-9, 2018 – our planet Earth flies in between the sun and the outer planet Jupiter. That passage places Jupiter – largest world in our solar system, and a very bright planet in our sky – opposite the sun. In other words, Jupiter is now rising in the east as the sun is setting below the western horizon. Astronomers call this event an opposition of Jupiter.
Opposition marks the middle of the best time of year to see a planet. That’s because it’s when the planet is up all night and generally closest for the year (the exact date of Jupiter at its closest this year is May 10).
Your astronomical calendar for 2018 likely gives the date and time of Jupiter’s 2018 opposition as May 9 at 1 UTC. That translates to May 8 at 8 p.m. Central Daylight Time in North America (translate UTC to your time).
Jupiter (red) completes one orbit of the sun (center) for every 11.86 orbits of the Earth (blue). Our orbit is smaller, and we move faster! Animation via Wikimedia Commons.
Rising in the east around sunset, Jupiter climbs highest in the sky at midnight. It sets in the west around sunrise. Jupiter is always bright; it’s the largest planet in our solar system. It shines more brightly than any star in the evening sky.
With the exception of the sun and moon, only Venus – the brightest planet, now in the west after sunset – outshines Jupiter. Try catching both Venus and Jupiter at nightfall now. Venus will be blazing low in the west and Jupiter, a bit fainter but still brighter than any star, will be shining in the east. Venus will set as Jupiter ascends in the eastern sky.
At this 2018 opposition, Jupiter shines in front of the constellation Libra the Scales. The close 2nd-magnitude star to Jupiter is Zubenelgenubi, Libra’s alpha star. Dazzling Jupiter – a planet in our own solar system, and therefore much closer to us – outshines this star by over 100 times.
In any year, you can find the constellation Libra between the star Antares (to the east of Libra) and the star Spica (to the west of Libra, outside the chart). But in 2018, the planet Jupiter acts as your guide “star” to this fairly faint constellation. Northern Hemisphere viewers will find Jupiter and Libra in the south around midnight in May 2018. Southern Hemisphere viewers will find Jupiter and Libra closer to overhead at midnight.
Jupiter comes to opposition about every 13 months. That’s how long Earth takes to travel once around the sun relative to Jupiter. As a result – according to our earthly calendars – Jupiter’s opposition comes about a month later each year.
Last year – in 2017 – Jupiter’s opposition date was April 7.
Next year – in 2019 – it’ll be June 10.
Jupiter and its large moon Ganymede as captured on May 3, 2018 by Eric Bayne.
Jupiter is sometimes called a failed star. You would need at least 80 Jupiters – rolled into a ball – to be hot enough inside for thermonuclear reactions to ignite. In other words, Jupiter is not massive enough to shine as stars do.
But Jupiter is the largest and most massive planet in our solar system. So when the sun goes down on this May night, you might — if you’re fanciful enough — you might imagine bright Jupiter as a tiny sun all night long.
Bottom line: Be sure to look for Jupiter on the night of May 8-9, 2019 as this world reaches opposition, the point opposite the sun in our sky. About one and one-half day later, on May 10, at 12 UTC, Jupiter reaches its closest point to Earth for this year!
Donate: Your support means the world to us
from EarthSky https://ift.tt/1UuLm0p