Before sunrise in the next several mornings – March 7 to 11, 2018 – let the waning moon be your guide the morning planets, Jupiter, Mars and Saturn.
Jupiter. That brilliant starlike object close to the moon on the mornings of March 7 and 8 is Jupiter, 5th planet outward from the sun. It’ll be hard to miss Jupiter, as it’s the second-brightest celestial object (after the moon) to light up the morning sky. Venus is a brighter planet than Jupiter, but Venus is now in the early evening sky and will remain an evening “star” until October 2018. Jupiter, meanwhile, comes up around midnight in early March 2018, and it shines high in the sky at dawn.
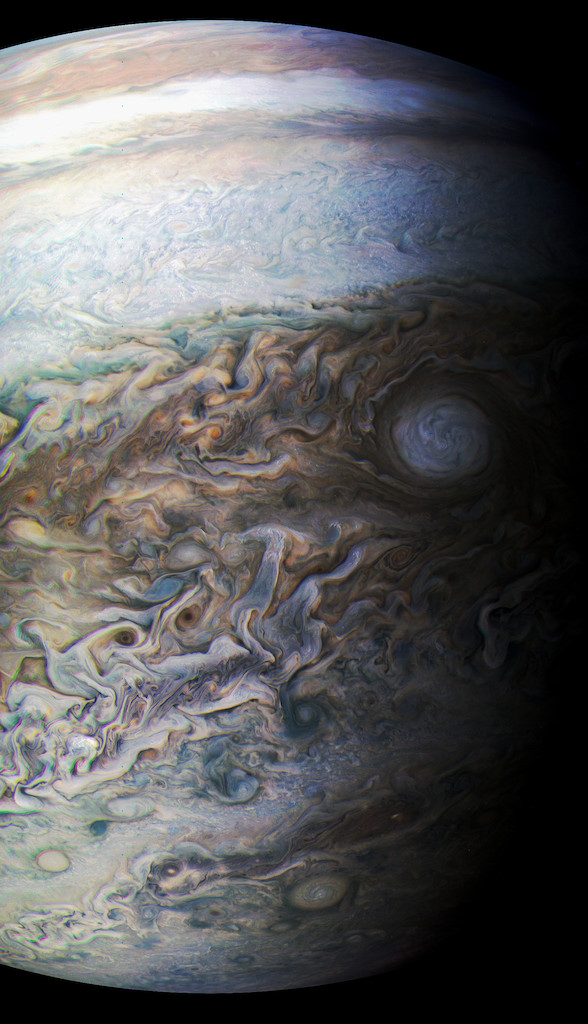
Jupiter is bright for a good reason. It’s the most massive planet in the solar system, with a very reflective cloud cover. With a mass of 318 Earths, the king planet Jupiter has more than twice the mass of all other solar system planets, dwarf planets, moons and minor planets (asteroids) combined. Jupiter has a volume of over 1,300 Earths. Yet Jupiter is only about 1/1000th the mass and size of the sun!
On March 9, 2018, Jupiter is stationary in front of the constellation Libra the Scales, signaling the beginning of its retrograde motion in front of the stars. Normally, planets move eastward in front of the backdrop stars, but, as Earth prepares to pass between an outer planet (like Jupiter) and the sun, we see the planets change direction and begin moving toward the west.
We’ll go between Jupiter and the sun on May 9, 2019. Then astronomers will say that Jupiter is in opposition to the sun. In May, Jupiter will be rising in the east as the sun is setting in the west. Opposition marks the middle of the best time of year to see a planet.
The beginning of Jupiter’s retrograde motion on March 9 marks the beginning of this special time!
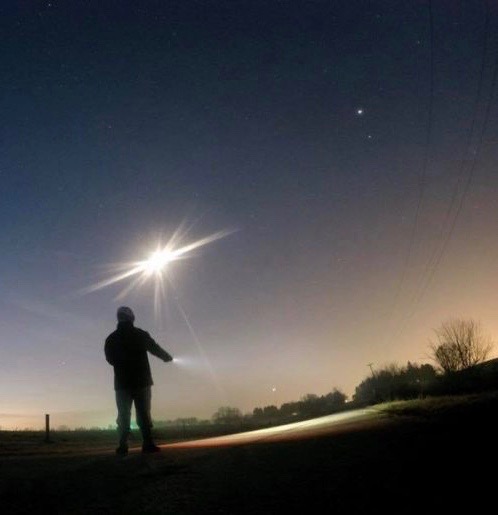
Niko Powe in Kewanee, Illinois caught Jupiter and Spica (upper right) on the morning of January 22, 2017. The bright object in this photo is the moon.
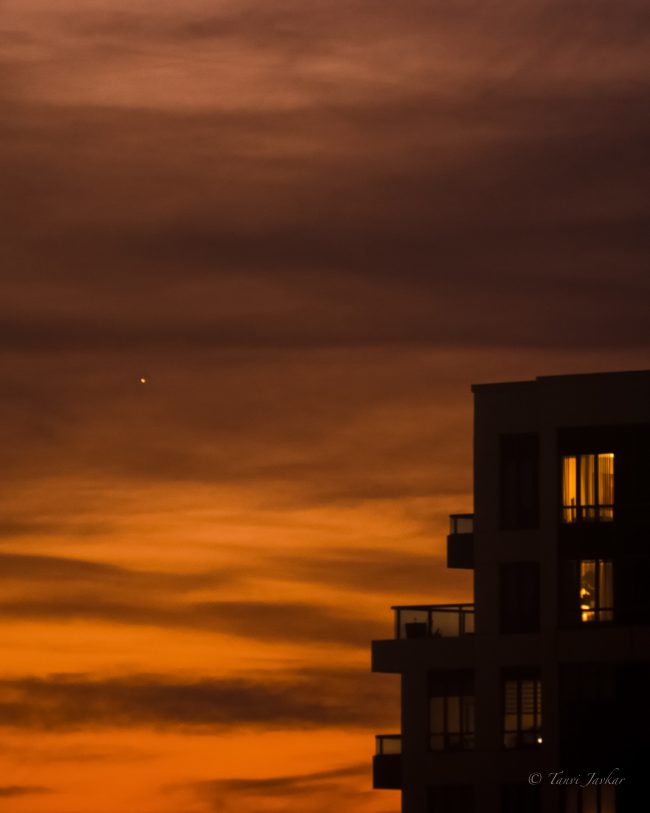
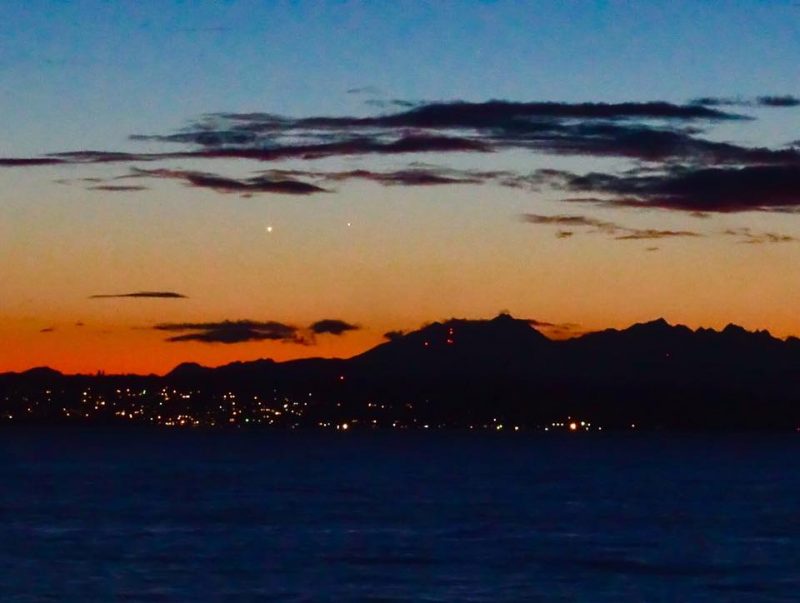
Mars and Saturn. Although Mars and Saturn are nowhere as bright as Jupiter, they still shine as brilliantly as first-magnitude stars. You can notice them any morning before dawn now, but look for them particularly around March 9, 10 and 11, when the moon is sweeping past.
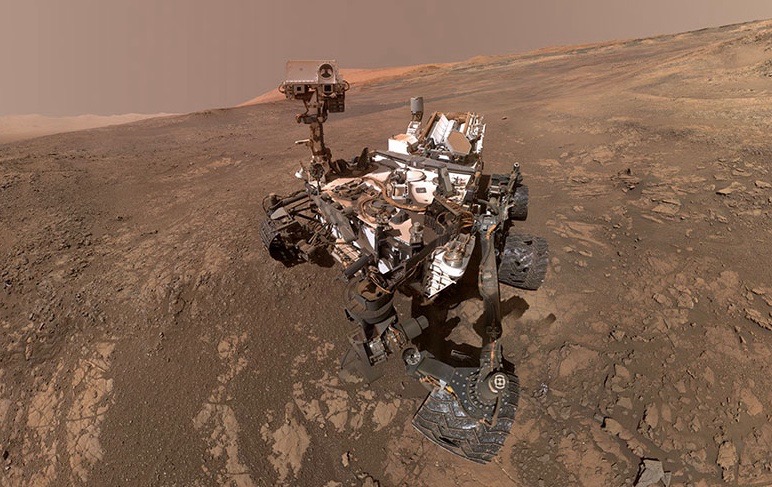
2018 will be a banner year for Mars. Most of the time, Jupiter ranks as he fourth-brightest celestial body to light up the heavens, after the sun, moon and Venus. But this year Mars will outshine Jupiter – claiming the title of the 4th-brightest celestial body – for roughly two months, from early July to early September 2018. Why? You guessed. Earth will be passing between Mars and the sun around then.
Read more: Mars brighter in 2018 than since 2003
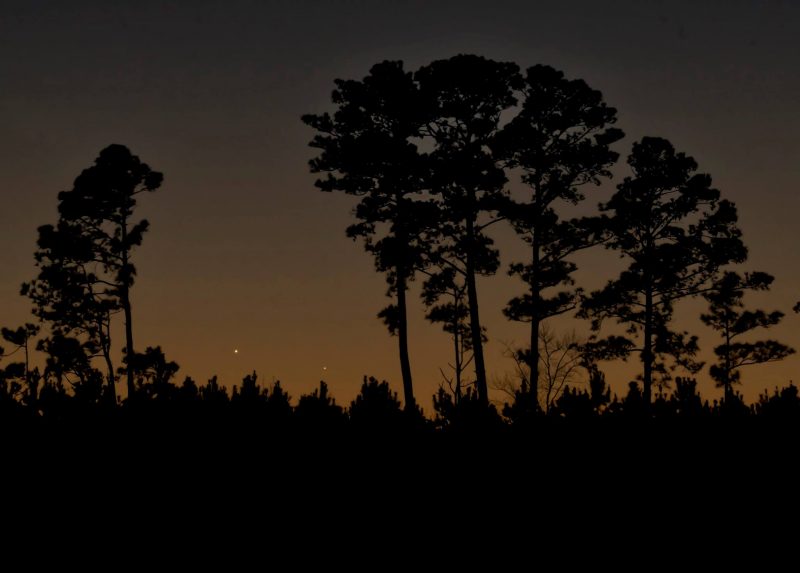
You can discern Saturn from Mars by color. Saturn appears golden while Mars glowers red. If you have difficulty distinguishing color with the eye alone, try looking at these colorful celestial gems with binoculars. Or, if you have a telescope, you can easily tell which is Saturn because of this planet’s majestic rings, which are quite visible in even a modest, backyard telescope.
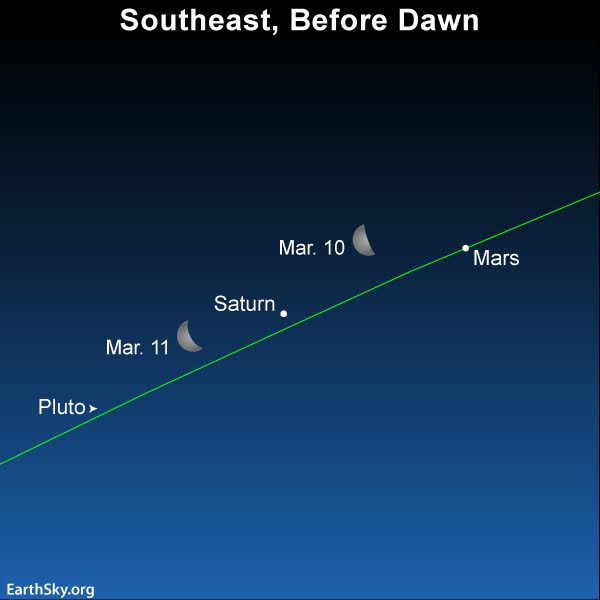
Here’s another chart, focusing on Mars and Saturn around the time the moon goes past them:
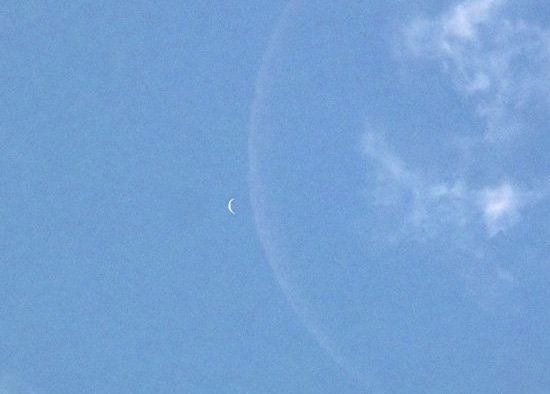
As the moon moves past the planets before dawn, it’ll also be waning in phase. Last quarter moon is March 9.
For the fun of it, we show the dwarf planet Pluto on the sky chart above. You won’t see Pluto. This faint and distant world is more than 2,000 times dimmer than the faintest star visible to the unaided eye on a dark night. It’s some 300,000 times fainter than Saturn.
Saturn is the most distant world you can easily see with the unaided eye, at a distance of about 10 astronomical units (that is, 10 AU, or 10 times the Earth’s distance from the sun). Pluto lies over three times the distance of Saturn, at 34 AU.
Click to find Saturn’s and Pluto’s present distance from Earth and sun, in AU
Because Mars is closer to the sun and Earth than Saturn and Pluto are, Mars travels at a much faster clip through the constellations of the zodiac than either Saturn and Pluto. Traveling in an eastward direction – toward sunrise – Mars will catch up with Saturn on April 2, 2018, and then will catch up Pluto on April 25, 2018.
Earth will catch up to Saturn – bringing Saturn to its 2018 opposition in our sky – on June 27.
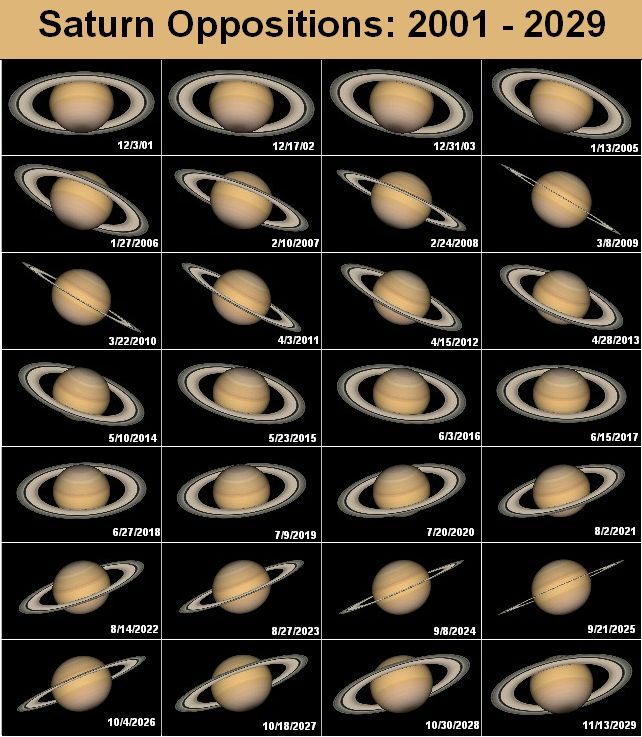
The tilt of Saturn’s rings has a great impact on its overall brightness. In years when Saturn’s rings are edge-on as seen from Earth (2009 and 2025), Saturn appears considerably dimmer than in years when Saturn’s rings a maximally titled toward Earth (2017 and 2032). Image via Wikimedia Commons.
Bottom line: Three bright, superior planets – that is, those orbiting the sun outward from Earth’s orbit – can be found between midnight and dawn now. The moon sweeps past Jupiter, then Mars, then Saturn on the mornings of March 7 to March 11, 2018.
from EarthSky http://ift.tt/2FXItmR
Before sunrise in the next several mornings – March 7 to 11, 2018 – let the waning moon be your guide the morning planets, Jupiter, Mars and Saturn.
Jupiter. That brilliant starlike object close to the moon on the mornings of March 7 and 8 is Jupiter, 5th planet outward from the sun. It’ll be hard to miss Jupiter, as it’s the second-brightest celestial object (after the moon) to light up the morning sky. Venus is a brighter planet than Jupiter, but Venus is now in the early evening sky and will remain an evening “star” until October 2018. Jupiter, meanwhile, comes up around midnight in early March 2018, and it shines high in the sky at dawn.
Jupiter is bright for a good reason. It’s the most massive planet in the solar system, with a very reflective cloud cover. With a mass of 318 Earths, the king planet Jupiter has more than twice the mass of all other solar system planets, dwarf planets, moons and minor planets (asteroids) combined. Jupiter has a volume of over 1,300 Earths. Yet Jupiter is only about 1/1000th the mass and size of the sun!
On March 9, 2018, Jupiter is stationary in front of the constellation Libra the Scales, signaling the beginning of its retrograde motion in front of the stars. Normally, planets move eastward in front of the backdrop stars, but, as Earth prepares to pass between an outer planet (like Jupiter) and the sun, we see the planets change direction and begin moving toward the west.
We’ll go between Jupiter and the sun on May 9, 2019. Then astronomers will say that Jupiter is in opposition to the sun. In May, Jupiter will be rising in the east as the sun is setting in the west. Opposition marks the middle of the best time of year to see a planet.
The beginning of Jupiter’s retrograde motion on March 9 marks the beginning of this special time!
Niko Powe in Kewanee, Illinois caught Jupiter and Spica (upper right) on the morning of January 22, 2017. The bright object in this photo is the moon.
Mars and Saturn. Although Mars and Saturn are nowhere as bright as Jupiter, they still shine as brilliantly as first-magnitude stars. You can notice them any morning before dawn now, but look for them particularly around March 9, 10 and 11, when the moon is sweeping past.
2018 will be a banner year for Mars. Most of the time, Jupiter ranks as he fourth-brightest celestial body to light up the heavens, after the sun, moon and Venus. But this year Mars will outshine Jupiter – claiming the title of the 4th-brightest celestial body – for roughly two months, from early July to early September 2018. Why? You guessed. Earth will be passing between Mars and the sun around then.
Read more: Mars brighter in 2018 than since 2003
You can discern Saturn from Mars by color. Saturn appears golden while Mars glowers red. If you have difficulty distinguishing color with the eye alone, try looking at these colorful celestial gems with binoculars. Or, if you have a telescope, you can easily tell which is Saturn because of this planet’s majestic rings, which are quite visible in even a modest, backyard telescope.
Here’s another chart, focusing on Mars and Saturn around the time the moon goes past them:
As the moon moves past the planets before dawn, it’ll also be waning in phase. Last quarter moon is March 9.
For the fun of it, we show the dwarf planet Pluto on the sky chart above. You won’t see Pluto. This faint and distant world is more than 2,000 times dimmer than the faintest star visible to the unaided eye on a dark night. It’s some 300,000 times fainter than Saturn.
Saturn is the most distant world you can easily see with the unaided eye, at a distance of about 10 astronomical units (that is, 10 AU, or 10 times the Earth’s distance from the sun). Pluto lies over three times the distance of Saturn, at 34 AU.
Click to find Saturn’s and Pluto’s present distance from Earth and sun, in AU
Because Mars is closer to the sun and Earth than Saturn and Pluto are, Mars travels at a much faster clip through the constellations of the zodiac than either Saturn and Pluto. Traveling in an eastward direction – toward sunrise – Mars will catch up with Saturn on April 2, 2018, and then will catch up Pluto on April 25, 2018.
Earth will catch up to Saturn – bringing Saturn to its 2018 opposition in our sky – on June 27.
The tilt of Saturn’s rings has a great impact on its overall brightness. In years when Saturn’s rings are edge-on as seen from Earth (2009 and 2025), Saturn appears considerably dimmer than in years when Saturn’s rings a maximally titled toward Earth (2017 and 2032). Image via Wikimedia Commons.
Bottom line: Three bright, superior planets – that is, those orbiting the sun outward from Earth’s orbit – can be found between midnight and dawn now. The moon sweeps past Jupiter, then Mars, then Saturn on the mornings of March 7 to March 11, 2018.
from EarthSky http://ift.tt/2FXItmR