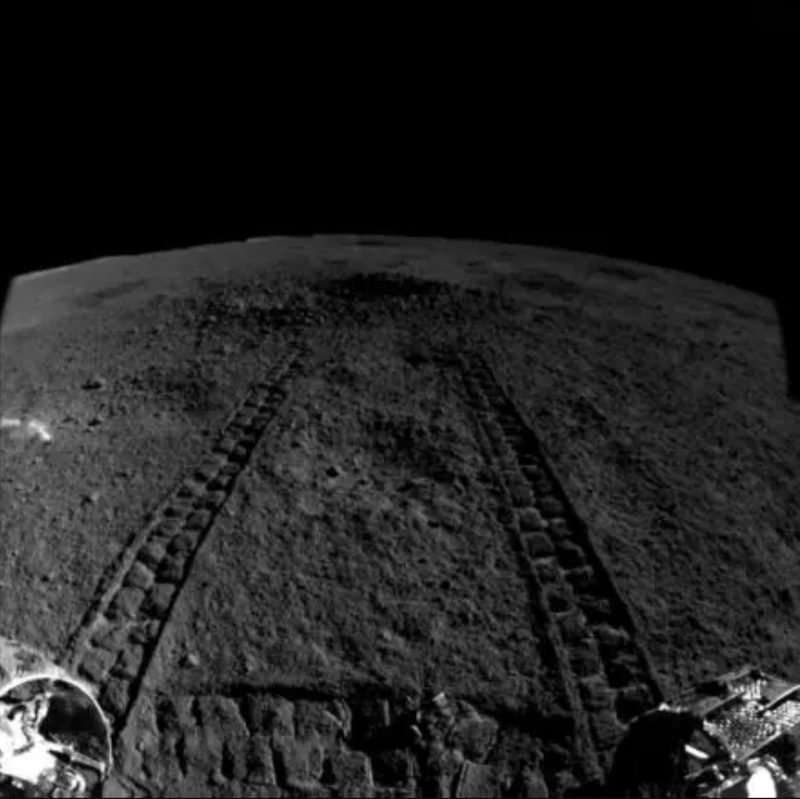
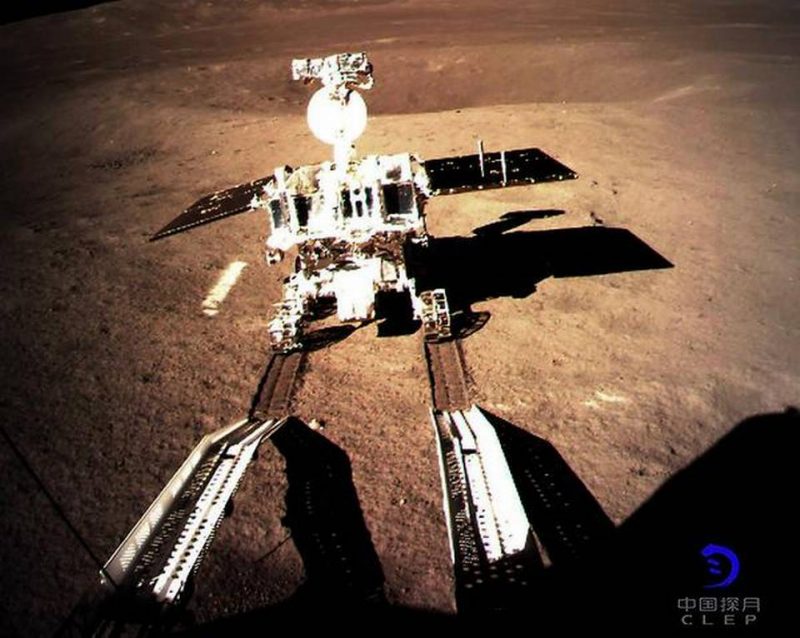
Tracks from China’s Yutu-2 rover approaching the crater where the rover has reportedly discovered a “gel-like” substance on the far side of the moon. Few details are known at this point. Image via China Lunar Exploration Program (CLEP)/Space.com.
What has China’s Yutu-2 rover discovered on the far side of the moon? That is a question a lot of people are asking after an intriguing report came out from Space.com a few days ago, which referenced a “gel-like” substance discovered in a small crater. Not many details are known right now, but there are some possible clues, as provided by planetary scientists who have commented on the finding.
The discovery was published in the “Drive Diary” for Yutu-2 (literally “Jade Rabbit”) in the Chinese government-sanctioned publication Our Space, on August 17, 2019. It was also tweeted by the state-run People’s Daily newspaper.
Yutu-2, the follow-up to the first Yutu rover and part of the Chang’e 4 mission, first made the discovery back on July 25, day 8 of its mission. Previous driving plans were postponed, so scientists could take a better look at the material with the rover’s instruments. The oddity was first noticed by mission team member Yu Tianyi while he was checking images from the main camera on the rover. There were many small craters around, but one of them looked unusual, containing something with an unexpected color and luster.
Yutu-2 rover, part of China’s Chang’e-4 mission, has discovered an unusually colored “gel-like” substance during its exploration activities on the far side of the moon. Mission scientists are now trying to figure out what the mysterious material is. What do you think it is? pic.twitter.com/auw2F2JYvk
— People's Daily, China (@PDChina) September 2, 2019
The material has been described as gel-like, but it should be noted that the actual appearance still isn’t known for certain yet. As others have noted, it’s possible that this is a mistranslation from Chinese reports. Some planetary scientists have speculated that what has been found may be impact melt glass from a meteorite strike (and the substance is in a crater) or perhaps volcanic glass from an ancient volcanic explosion. Both of those have been found before on the moon, including by Apollo astronauts.
According to Mahesh Anand, a planetary scientist at the Open University in the United Kingdom, in Newsweek:
The fact that it has been observed associated with a small impact crater, this finding could be extremely exciting as it would indicate that a very different material could just be hiding underneath the very top surface. This would assume even a greater significance if these material turn out to have experienced interaction with water-ice (as the possibility of existence of water-ice in the top few meters of the lunar south polar region is predicted on the basis of recent remote sensing dataset).
As Walter Freeman, a physicist at Syracuse University, also noted:
We have lots of processes on Earth that cause interesting geology: the action of water, wind, and volcanism. But the moon has none of these, so meteorite impacts are the main thing that reshapes its surface. There’s a bit of precedent for this on Earth: at the site where the first nuclear bomb was tested in New Mexico, there is a glassy mineral called “trinitite” formed from the heat of the explosion. The same thing happens around meteorite impacts here.
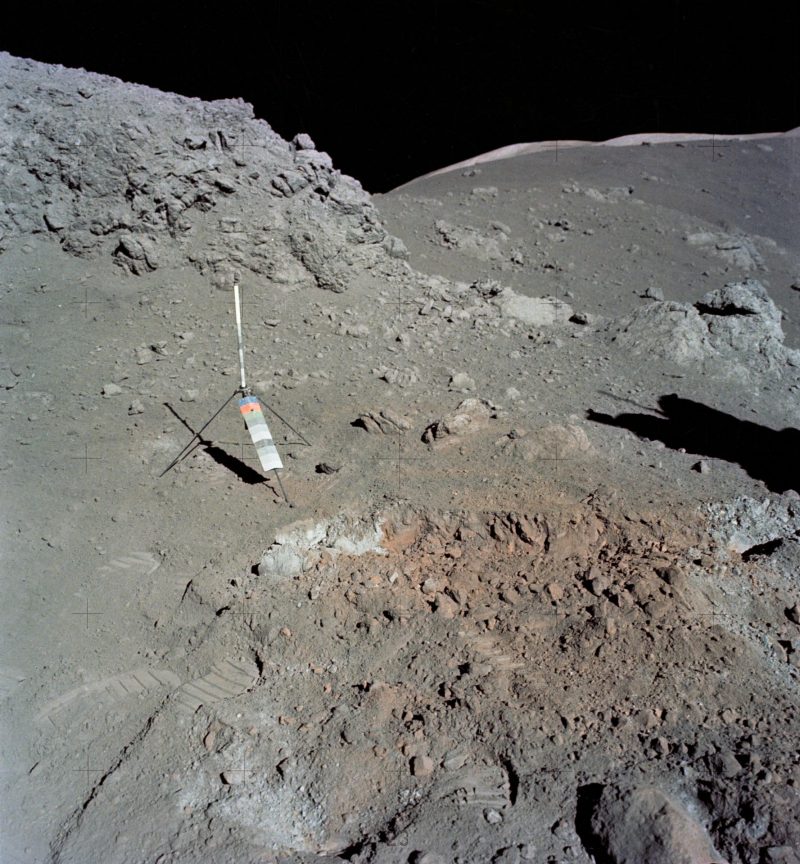
In 1972, Apollo 17 astronauts discovered unusual orange-colored soil on the moon. Could the Chinese rover discovery be of something similar? Image via NASA/Space.com.
In Our Space, the material was described as being significantly different from the surrounding lunar soil in shape and color, but not specifically how.
Both the material and the crater itself were examined with the rover’s Visible and Near-Infrared Spectrometer (VNIS) instrument, which detects light that is scattered or reflected, to reveal their makeup. As previously reported, VNIS also detected material that originated from the lunar mantle, in the regolith of Von Kármán crater. That discovery was announced last May.
Is this new material the same or similar to what was found in Von Kármán crater? We don’t know yet, and there is still little information to go on. It would be odd if it actually was gel-like, but at the moment, most other scientists think that it is probably more like impact melt or volcanic glass. We don’t even know the specific color yet, other than it is “unusual.”
Could it also be similar to what Apollo 17 astronauts found in 1972? They discovered orange-colored soil near the Taurus-Littrow landing site, created during a volcanic eruption 3.64 billion years ago.
View of the Yutu-2 rover as it rolled off the Chang’e-4 lander last January. Image via China National Space Administration (CNSA)/The Hindu.
So far, there haven’t been any photos or analysis results released of the “gel” itself, so we will just have to wait for more information.
The Yutu-2 rover will now continue its journey west of the landing site. What else might it find? Yutu-2 was launched in December 2018 on the Chang’e 4 lander, landing in Aitken Basin near the south pole of the moon in January, and is the first rover to explore the far side of our closest celestial neighbor. As Zou Yongliao at the Chinese Academy of Sciences told Xinhua:
The far side of the moon has unique features never before explored on site. The exploration of this virgin land by Chang’e-4 might bring breakthrough findings.
For now, the “moon gel” finding remains a mystery, but stay tuned for further updates when more information becomes available.
Bottom line: The Chinese rover Yutu-2 has discovered an unusual “gel-like” material on the far side of the moon, according to state-run sources. But details are limited right now as to what it might actually be.
from EarthSky https://ift.tt/31cS6Yq
Tracks from China’s Yutu-2 rover approaching the crater where the rover has reportedly discovered a “gel-like” substance on the far side of the moon. Few details are known at this point. Image via China Lunar Exploration Program (CLEP)/Space.com.
What has China’s Yutu-2 rover discovered on the far side of the moon? That is a question a lot of people are asking after an intriguing report came out from Space.com a few days ago, which referenced a “gel-like” substance discovered in a small crater. Not many details are known right now, but there are some possible clues, as provided by planetary scientists who have commented on the finding.
The discovery was published in the “Drive Diary” for Yutu-2 (literally “Jade Rabbit”) in the Chinese government-sanctioned publication Our Space, on August 17, 2019. It was also tweeted by the state-run People’s Daily newspaper.
Yutu-2, the follow-up to the first Yutu rover and part of the Chang’e 4 mission, first made the discovery back on July 25, day 8 of its mission. Previous driving plans were postponed, so scientists could take a better look at the material with the rover’s instruments. The oddity was first noticed by mission team member Yu Tianyi while he was checking images from the main camera on the rover. There were many small craters around, but one of them looked unusual, containing something with an unexpected color and luster.
Yutu-2 rover, part of China’s Chang’e-4 mission, has discovered an unusually colored “gel-like” substance during its exploration activities on the far side of the moon. Mission scientists are now trying to figure out what the mysterious material is. What do you think it is? pic.twitter.com/auw2F2JYvk
— People's Daily, China (@PDChina) September 2, 2019
The material has been described as gel-like, but it should be noted that the actual appearance still isn’t known for certain yet. As others have noted, it’s possible that this is a mistranslation from Chinese reports. Some planetary scientists have speculated that what has been found may be impact melt glass from a meteorite strike (and the substance is in a crater) or perhaps volcanic glass from an ancient volcanic explosion. Both of those have been found before on the moon, including by Apollo astronauts.
According to Mahesh Anand, a planetary scientist at the Open University in the United Kingdom, in Newsweek:
The fact that it has been observed associated with a small impact crater, this finding could be extremely exciting as it would indicate that a very different material could just be hiding underneath the very top surface. This would assume even a greater significance if these material turn out to have experienced interaction with water-ice (as the possibility of existence of water-ice in the top few meters of the lunar south polar region is predicted on the basis of recent remote sensing dataset).
As Walter Freeman, a physicist at Syracuse University, also noted:
We have lots of processes on Earth that cause interesting geology: the action of water, wind, and volcanism. But the moon has none of these, so meteorite impacts are the main thing that reshapes its surface. There’s a bit of precedent for this on Earth: at the site where the first nuclear bomb was tested in New Mexico, there is a glassy mineral called “trinitite” formed from the heat of the explosion. The same thing happens around meteorite impacts here.
In 1972, Apollo 17 astronauts discovered unusual orange-colored soil on the moon. Could the Chinese rover discovery be of something similar? Image via NASA/Space.com.
In Our Space, the material was described as being significantly different from the surrounding lunar soil in shape and color, but not specifically how.
Both the material and the crater itself were examined with the rover’s Visible and Near-Infrared Spectrometer (VNIS) instrument, which detects light that is scattered or reflected, to reveal their makeup. As previously reported, VNIS also detected material that originated from the lunar mantle, in the regolith of Von Kármán crater. That discovery was announced last May.
Is this new material the same or similar to what was found in Von Kármán crater? We don’t know yet, and there is still little information to go on. It would be odd if it actually was gel-like, but at the moment, most other scientists think that it is probably more like impact melt or volcanic glass. We don’t even know the specific color yet, other than it is “unusual.”
Could it also be similar to what Apollo 17 astronauts found in 1972? They discovered orange-colored soil near the Taurus-Littrow landing site, created during a volcanic eruption 3.64 billion years ago.
View of the Yutu-2 rover as it rolled off the Chang’e-4 lander last January. Image via China National Space Administration (CNSA)/The Hindu.
So far, there haven’t been any photos or analysis results released of the “gel” itself, so we will just have to wait for more information.
The Yutu-2 rover will now continue its journey west of the landing site. What else might it find? Yutu-2 was launched in December 2018 on the Chang’e 4 lander, landing in Aitken Basin near the south pole of the moon in January, and is the first rover to explore the far side of our closest celestial neighbor. As Zou Yongliao at the Chinese Academy of Sciences told Xinhua:
The far side of the moon has unique features never before explored on site. The exploration of this virgin land by Chang’e-4 might bring breakthrough findings.
For now, the “moon gel” finding remains a mystery, but stay tuned for further updates when more information becomes available.
Bottom line: The Chinese rover Yutu-2 has discovered an unusual “gel-like” material on the far side of the moon, according to state-run sources. But details are limited right now as to what it might actually be.
from EarthSky https://ift.tt/31cS6Yq