Aerial footage shows total devastation in Abaco, Bahamas after Hurricane Dorian.
Get the most current updates on Dorian from NOAA here.
By Dale Dominey-Howes, University of Sydney
At least seven people have died in the wake of Hurricane Dorian in the Bahamas, although that figure is expected to rise as rescue work continues.
Dorian began life as a small tropical depression southeast of the Lesser Antilles on August 24, 2019, and grew to be a Category 5 hurricane as it devastated the Bahamas.
At the time of writing, Dorian has been downgraded to a Category 2 storm and is currently tracking northward parallel to the US coast.

Path of Hurricane Dorian from its birth southeast of the Lesser Antilles to Tuesday September 3, 2019. Image via NOAA
Where Dorian decides to travel next is still hard to forecast. It does not look like Dorian will make landfall in the United States, but the US National Hurricane Center currently expects it to turn northwards by Wednesday evening, followed by a turn towards the north-northeast on Thursday morning local time.
On this track, the core of Hurricane Dorian will move dangerously close to the Florida east coast and the Georgia coast. The center of Dorian is forecast to move near or over the coast of South Carolina and North Carolina on Thursday through Friday morning.
Dorian is the second most powerful Atlantic hurricane on record, packing sustained winds of more than 170 miles (270 km) per hour, with peak gusts approaching 350km/h. At its peak the storm system was more than 400 miles (700 km) in diameter, causing massive rainfall and a huge storm surge peaking at more than 23 feet (7 meters) above sea level – both contributing to substantial flooding.
As a Category 2 storm, it still has 110 miles (177 km) per hour winds and tremendous destructive capacity.
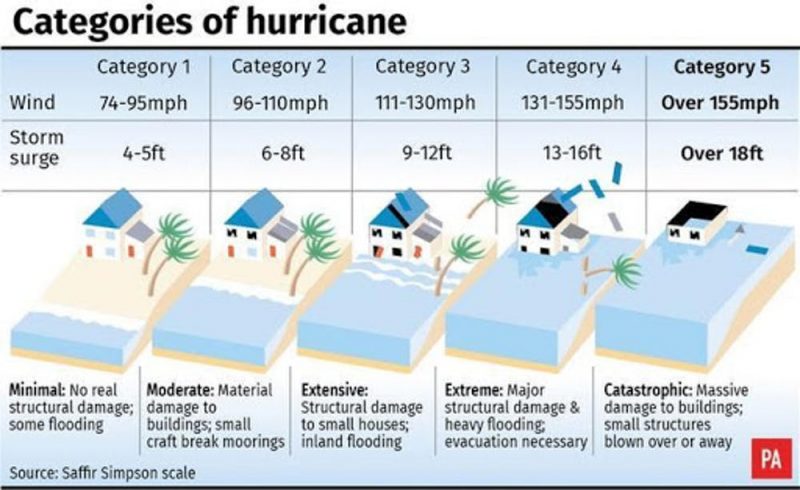
The Saffir-Simpson Scale for measuring the size and effects of hurricanes in the Atlantic. Image via PA Graphics.
Path of devastation
As Dorian passed over the Bahamas absolutely the worst scenario occurred: it more or less stopped dead in its tracks.
Slow-moving hurricanes do immense amounts of damage. Rather than moving on quickly, high winds, heavy rainfall and large storm surges all combine to hammer the landscape and of course, people, buildings and crucial infrastructure. Dorian sat over the Bahamas for more than 20 hours, maximizing the amount of damage.
The official death toll is currently seven, but Prime Minister Hubert Minnis and national and international emergency management agencies expect that number to rise sharply as response and recovery teams start to gain access to heavily damaged areas.
Aerial footage is emerging of extensive damage across wide areas, with total devastation of built structures and massive impact on the natural environment.

A massive rescue effort in the Bahamas has begun in the wake of Hurricane Dorian. Image via EPA/Petty Officer 3rd Class Hunter Medley/US Coast Guard.
Is Dorian linked to climate change?
Many people are understandably asking if there is a direct connection between human-induced climate change and Hurricane Dorian. The short answer is it’s hard to say.
Here’s what we know. By adding greenhouse warming gases to the atmosphere, more heat is trapped in the atmosphere and oceans. Increasing heat equals increasing energy in the atmosphere-ocean system, and increased heat fuels extreme events such as hurricanes, heatwaves, storms, and floods. A new science called “attribution” investigates the statistical probability that a particular event such as Hurricane Dorian is more likely in a human-warmed climate. Work is now under way to gather the data necessary to determine mathematically whether Dorian was likely connected to a warming world.
Regardless, previous work shows Atlantic hurricanes have been getting larger and more intense, and significantly more destructive.
Dale Dominey-Howes, Professor of Hazards and Disaster Risk Sciences, University of Sydney
This article is republished from The Conversation under a Creative Commons license. Read the original article.
![]()
Bottom line: Information on Hurricane Dorian.
from EarthSky https://ift.tt/2ZHu6iC
Aerial footage shows total devastation in Abaco, Bahamas after Hurricane Dorian.
Get the most current updates on Dorian from NOAA here.
By Dale Dominey-Howes, University of Sydney
At least seven people have died in the wake of Hurricane Dorian in the Bahamas, although that figure is expected to rise as rescue work continues.
Dorian began life as a small tropical depression southeast of the Lesser Antilles on August 24, 2019, and grew to be a Category 5 hurricane as it devastated the Bahamas.
At the time of writing, Dorian has been downgraded to a Category 2 storm and is currently tracking northward parallel to the US coast.
Path of Hurricane Dorian from its birth southeast of the Lesser Antilles to Tuesday September 3, 2019. Image via NOAA
Where Dorian decides to travel next is still hard to forecast. It does not look like Dorian will make landfall in the United States, but the US National Hurricane Center currently expects it to turn northwards by Wednesday evening, followed by a turn towards the north-northeast on Thursday morning local time.
On this track, the core of Hurricane Dorian will move dangerously close to the Florida east coast and the Georgia coast. The center of Dorian is forecast to move near or over the coast of South Carolina and North Carolina on Thursday through Friday morning.
Dorian is the second most powerful Atlantic hurricane on record, packing sustained winds of more than 170 miles (270 km) per hour, with peak gusts approaching 350km/h. At its peak the storm system was more than 400 miles (700 km) in diameter, causing massive rainfall and a huge storm surge peaking at more than 23 feet (7 meters) above sea level – both contributing to substantial flooding.
As a Category 2 storm, it still has 110 miles (177 km) per hour winds and tremendous destructive capacity.
The Saffir-Simpson Scale for measuring the size and effects of hurricanes in the Atlantic. Image via PA Graphics.
Path of devastation
As Dorian passed over the Bahamas absolutely the worst scenario occurred: it more or less stopped dead in its tracks.
Slow-moving hurricanes do immense amounts of damage. Rather than moving on quickly, high winds, heavy rainfall and large storm surges all combine to hammer the landscape and of course, people, buildings and crucial infrastructure. Dorian sat over the Bahamas for more than 20 hours, maximizing the amount of damage.
The official death toll is currently seven, but Prime Minister Hubert Minnis and national and international emergency management agencies expect that number to rise sharply as response and recovery teams start to gain access to heavily damaged areas.
Aerial footage is emerging of extensive damage across wide areas, with total devastation of built structures and massive impact on the natural environment.
A massive rescue effort in the Bahamas has begun in the wake of Hurricane Dorian. Image via EPA/Petty Officer 3rd Class Hunter Medley/US Coast Guard.
Is Dorian linked to climate change?
Many people are understandably asking if there is a direct connection between human-induced climate change and Hurricane Dorian. The short answer is it’s hard to say.
Here’s what we know. By adding greenhouse warming gases to the atmosphere, more heat is trapped in the atmosphere and oceans. Increasing heat equals increasing energy in the atmosphere-ocean system, and increased heat fuels extreme events such as hurricanes, heatwaves, storms, and floods. A new science called “attribution” investigates the statistical probability that a particular event such as Hurricane Dorian is more likely in a human-warmed climate. Work is now under way to gather the data necessary to determine mathematically whether Dorian was likely connected to a warming world.
Regardless, previous work shows Atlantic hurricanes have been getting larger and more intense, and significantly more destructive.
Dale Dominey-Howes, Professor of Hazards and Disaster Risk Sciences, University of Sydney
This article is republished from The Conversation under a Creative Commons license. Read the original article.
![]()
Bottom line: Information on Hurricane Dorian.
from EarthSky https://ift.tt/2ZHu6iC