Above: A lovely shot of a full moon in 2017 from Peter Ryan in East Greenwich, Rhode Island.
On August 14 and 15, 2019, everyone around the world (except far-northern Arctic latitudes) will see a full-looking moon lighting up the nighttime from dusk until dawn. In North America, we often call the August full moon the Sturgeon Moon, Green Corn Moon or Grain Moon. For the Northern Hemisphere, this August full moon ushers in the second of three full moons of the summer season.
By season, we are referring to the time period between the June solstice and the September equinox.
In the Southern Hemisphere, where it’s the opposite season, this is second of three winter full moons. August full moons names for the Southern Hemisphere include the Snow Moon, Storm Moon, Hunger Moon and Wolf Moon.
It’s very hard to tell when a moon is precisely full just by looking at it. This month’s moon turns precisely full on August 15 at 12:29 UTC, At US time zones, that translates to 8:29 a.m. EDT, 7:29 a.m. CDT, 6:29 a.m. MDT, 5:29 a.m. PST, 4:29 a.m. AKDT, and 2:29 a.m. HST (translate UTC to your time). But those times indicate only the crest of the moon’s full phase. They indicate when the moon is most opposite the sun for this month (180 degrees from the sun in ecliptic longitude).
Post your full moon photo at EarthSky Community Photos

Guess what? When the moon appears full (totally illuminated) in our sky, the Earth would appear new (totally dark) in the moon’s sky. This is a simulation of the new Earth as seen from the August 2019 full moon (August 15, 2019, at 12:29 UTC). Image via U.S. Naval Observatory.
To the eye, on the other hand, the moon appears over 99 percent illuminated for about a day before and after full moon. People around the world will regard the moon as full on both August 14 and August 15.
Click here or here to know how much of the moon’s face is illuminated in sunlight for right now or any chosen time.
At about the time of the full moon, the moon rises in the east around sunset, climbs highest up for the night around midnight and sets in the west around sunrise. So these next few nights, look for the moon in your eastern sky at dusk and your western sky at dawn.
Want to know the exact time for the full moon at your locality, plus the moonrise and moonset times? Click here and remember to check the Moon phases and Moonrise and moonset boxes.
This August 2019 full moon does not pass through the antisolar point – the point that’s exactly opposite the sun – or else this full moon would undergo a total lunar eclipse. The last time the full moon passed through the antisolar point and through the center of the Earth’s dark umbral shadow was over a year ago, when it staged the longest total lunar eclipse of the 21st century (2001 to 2100) on July 27, 2018.
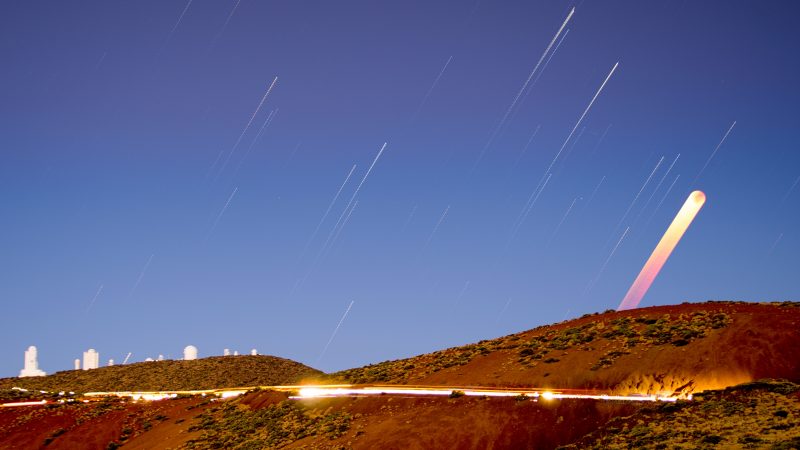
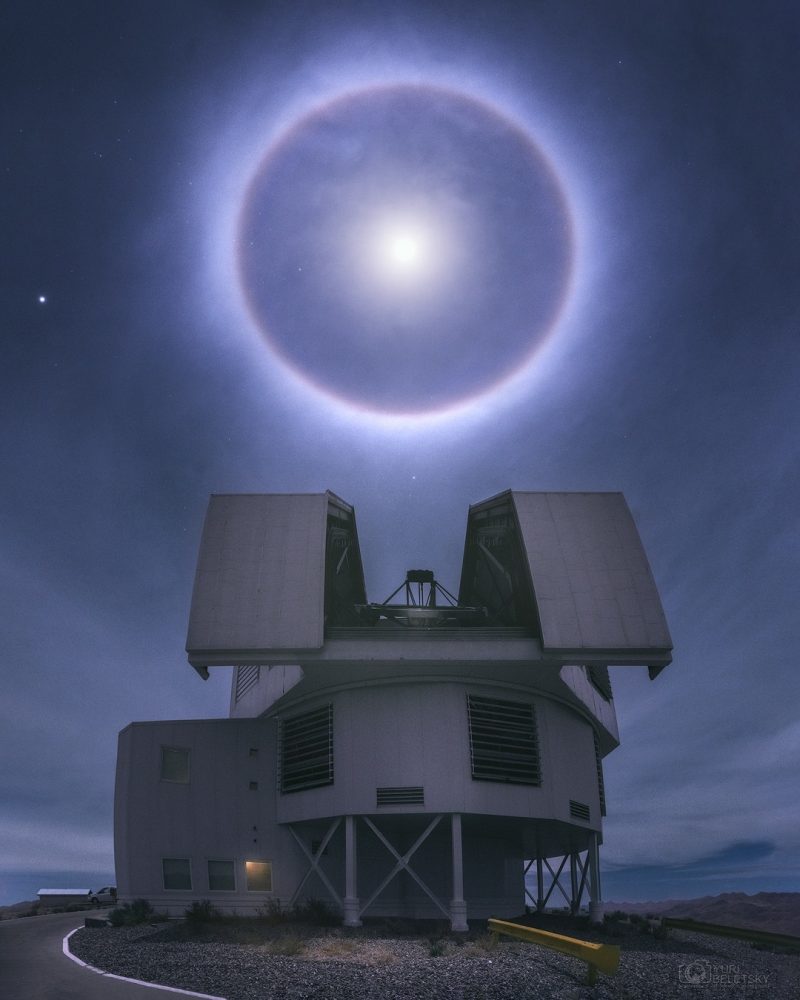
The July 27, 2018, eclipsed moon rises over the observatories of Instituto Astrofisica de Canarias, In Tenerife. Roberto Porto acquired 200 images to make this star trail composite. See more photos of the July 27, 2018, lunar eclipse.
Last month, in July 2019, the full moon missed the anti-solar point. Yet the moon did clip the southern portion of the Earth’s umbral dark shadow to showcase a partial lunar eclipse on July 16, 2019.
The full moon won’t sweep through the Earth’s umbra again until May 26, 2021. But the moon will swing well north of the anti-solar point, to display the second-shortest total lunar eclipse of the 21st century (2001 to 2100).
The full moon won’t meet up with the antisolar point until it barely grazes the center of the Earth’s shadow during the total lunar eclipse of May 16, 2022.
The worldwide map below shows the day and night sides of Earth at the instant of the August 2019 full moon (August 15, 2019, at 12:29 UTC). The shadow line at left (running through North America) represents sunrise August 15 whereas the shadow line at the right (crossing Asia) depicts sunset August 15.
You have to be on the nighttime side of Earth to see the moon at the instant it turns full.

Worldwide map via the U.S. Naval Observatory shows the day and night sides of Earth at the instant of the August 2019 full moon (August 15, 2019, at 12:29 UTC). The shadow line at left (running through North America) represents sunrise August 15 whereas the shadow line at the right (crossing Asia) depicts sunset August 15.
Bottom line: On both August 14 and 15, 2019, the brilliant full moon drenches the nighttime with moonlight from dusk until dawn.
from EarthSky https://ift.tt/2YXLxHv
Above: A lovely shot of a full moon in 2017 from Peter Ryan in East Greenwich, Rhode Island.
On August 14 and 15, 2019, everyone around the world (except far-northern Arctic latitudes) will see a full-looking moon lighting up the nighttime from dusk until dawn. In North America, we often call the August full moon the Sturgeon Moon, Green Corn Moon or Grain Moon. For the Northern Hemisphere, this August full moon ushers in the second of three full moons of the summer season.
By season, we are referring to the time period between the June solstice and the September equinox.
In the Southern Hemisphere, where it’s the opposite season, this is second of three winter full moons. August full moons names for the Southern Hemisphere include the Snow Moon, Storm Moon, Hunger Moon and Wolf Moon.
It’s very hard to tell when a moon is precisely full just by looking at it. This month’s moon turns precisely full on August 15 at 12:29 UTC, At US time zones, that translates to 8:29 a.m. EDT, 7:29 a.m. CDT, 6:29 a.m. MDT, 5:29 a.m. PST, 4:29 a.m. AKDT, and 2:29 a.m. HST (translate UTC to your time). But those times indicate only the crest of the moon’s full phase. They indicate when the moon is most opposite the sun for this month (180 degrees from the sun in ecliptic longitude).
Post your full moon photo at EarthSky Community Photos
Guess what? When the moon appears full (totally illuminated) in our sky, the Earth would appear new (totally dark) in the moon’s sky. This is a simulation of the new Earth as seen from the August 2019 full moon (August 15, 2019, at 12:29 UTC). Image via U.S. Naval Observatory.
To the eye, on the other hand, the moon appears over 99 percent illuminated for about a day before and after full moon. People around the world will regard the moon as full on both August 14 and August 15.
Click here or here to know how much of the moon’s face is illuminated in sunlight for right now or any chosen time.
At about the time of the full moon, the moon rises in the east around sunset, climbs highest up for the night around midnight and sets in the west around sunrise. So these next few nights, look for the moon in your eastern sky at dusk and your western sky at dawn.
Want to know the exact time for the full moon at your locality, plus the moonrise and moonset times? Click here and remember to check the Moon phases and Moonrise and moonset boxes.
This August 2019 full moon does not pass through the antisolar point – the point that’s exactly opposite the sun – or else this full moon would undergo a total lunar eclipse. The last time the full moon passed through the antisolar point and through the center of the Earth’s dark umbral shadow was over a year ago, when it staged the longest total lunar eclipse of the 21st century (2001 to 2100) on July 27, 2018.
The July 27, 2018, eclipsed moon rises over the observatories of Instituto Astrofisica de Canarias, In Tenerife. Roberto Porto acquired 200 images to make this star trail composite. See more photos of the July 27, 2018, lunar eclipse.
Last month, in July 2019, the full moon missed the anti-solar point. Yet the moon did clip the southern portion of the Earth’s umbral dark shadow to showcase a partial lunar eclipse on July 16, 2019.
The full moon won’t sweep through the Earth’s umbra again until May 26, 2021. But the moon will swing well north of the anti-solar point, to display the second-shortest total lunar eclipse of the 21st century (2001 to 2100).
The full moon won’t meet up with the antisolar point until it barely grazes the center of the Earth’s shadow during the total lunar eclipse of May 16, 2022.
The worldwide map below shows the day and night sides of Earth at the instant of the August 2019 full moon (August 15, 2019, at 12:29 UTC). The shadow line at left (running through North America) represents sunrise August 15 whereas the shadow line at the right (crossing Asia) depicts sunset August 15.
You have to be on the nighttime side of Earth to see the moon at the instant it turns full.
Worldwide map via the U.S. Naval Observatory shows the day and night sides of Earth at the instant of the August 2019 full moon (August 15, 2019, at 12:29 UTC). The shadow line at left (running through North America) represents sunrise August 15 whereas the shadow line at the right (crossing Asia) depicts sunset August 15.
Bottom line: On both August 14 and 15, 2019, the brilliant full moon drenches the nighttime with moonlight from dusk until dawn.
from EarthSky https://ift.tt/2YXLxHv


 Hat tip to the