56 articles this week.
Dual Use Technology
There's a move in the United States to muzzle and curtail research into climate change, particularly climate change caused by humans. The interests driving this regression are primarily concerned with maintaining the present vectors of money but manage to attract a large and supportive rabble of ideologically fixated folks who have a hard time with what they view as coercive pressure to behave responsibly, avoid creating messes that other people have to clean up etc.
The trouble is that voluntary or simulated ignorance bears opportunity costs. It's impossible to anticipate the the full benefit of scientific research; asking one question may answer others even as other avenues of inquiry open in the process of exploring the first query. Research truncated for commercial or ideological reasons denies us an unimaginable range of benefits.
As a case in point, just as methods such as "2+2=4" might be employed to calculate dimensions of wood for a project even as the same tools can add up money, so does climate research produce insight quite other than assessing how much doom our fossil fuel habits are depositing in our worry accounts. This week's collection includes a new evaluation (let's not say "projection") of how a plausibly scaled nuclear exchange between the United States and the Russian Federation would affect the world's climate, employing the latest climate modeling techniques— resources unavailable when the term "nuclear winter" first entered our vernacular. The results are quite chilling. Now— thanks to research primarily intended to model another problem— we can better understand a different avoidable scenario, hopefully helping us to make wiser choices.
The issue with wearing blinkers is that when you're blind, you can't predict what might stub your toe or how much it may hurt. This is such a simple and obvious concept that it's astounding we need to be reminded but for what it's worth: Don't choose to be blind.
No substitute for boots on the ground (or dipping instruments in water)
Long time reader Philippe C. pointed us to an article in the most recent AAAS Science conveying startling findings about melt rates of tidewater glaciers via direct observations, measurements that should help models perform better as discrepancies between observation and prediction are resolved. The format and acuity of the data gathered in this project seems well suited as fodder for mathematical derivations.
Suggestions welcome
This week's harvest of research includes other items (the first three in "Physical sciences") that came to us by suggestion (thank you, GEUS and BaerbelW). By "new research" we don't imply that what's published in this weekly synopsis must still be reeking of wet ink. And we certainly are not omniscient! Omissions are inevitable not least because we must employ the help of machines for providing much of our input. If you think we've missed something important, please let us know in comments below or via emailing contact(at)skepticalscience.com.
Physical sciences:
Sea-level rise in Denmark: Bridging local reconstructions and global projections
Modeling the Influence of the Weddell Polynya on the Filchner–Ronne Ice Shelf Cavity
Direct observations of submarine melt and subsurface geometry at a tidewater glacier
1.5°, 2°, and 3° global warming: visualizing European regions affected by multiple changes
Holocene sea-level variability from Chesapeake Bay Tidal Marshes, USA
Hemispheric asymmetry of tropical expansion under CO2 forcing
Stability of the Atlantic Meridional Overturning Circulation: A Review and Synthesis
Changing salinity gradients in the Baltic Sea as a consequence of altered freshwater budgets
Sixty Years of Widespread Warming in the Southern Mid- and High-Latitudes (1957-2016)
Mechanisms for global warming impacts on Madden-Julian Oscillation precipitation amplitude
Response of the Indian Ocean to the Tibetan Plateau thermal forcing in late spring
Getz Ice Shelf melt enhanced by freshwater discharge from beneath the West Antarctic Ice Sheet
On the possibility of a long subglacial river under the north Greenland ice sheet
A simple equation to study changes in rainfall statistics
Biology and anthropogenic climate change:
What do we know about soil carbon destabilization?
Negative feedback processes following drainage slow down permafrost degradation
Humans cope with and mitigate their global warming:
Learning from the Climate Change Debate to Avoid Polarisation on Negative Emissions
Adopting LEDs changes attitudes towards climate change: experimental evidence from China
Supporting climate change adaptation using historical climate analysis
Experiential Learning Processes Informing Climate Change Decision Support
Future changes and uncertainty in decision-relevant measures of East African climate
Barriers and drivers to adaptation to climate change—a field study of ten French local authorities
Bioclimatic conditions of the Portuguese wine denominations of origin under changing climates
A mobilities perspective on migration in the context of environmental change
Costs to achieve target net emissions reductions in the US electric sector using direct air capture
Normalisation of Paris agreement NDCs to enhance transparency and ambition
Discussing global warming leads to greater acceptance of climate science
The previous edition of Skeptical Science research news may be found here.
from Skeptical Science https://ift.tt/2K4K3qB


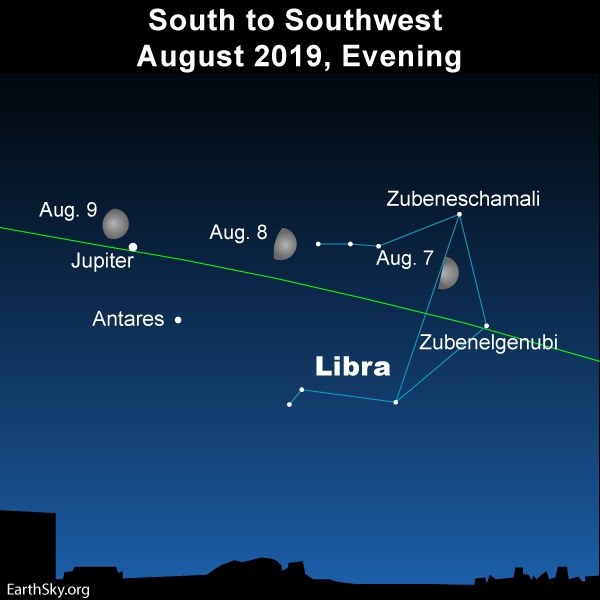
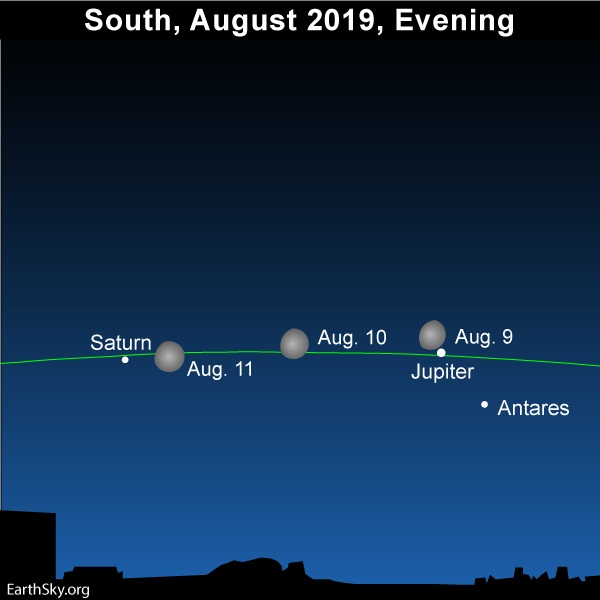 The moon will meet up with the king planet Jupiter on or near August 9, 2019.