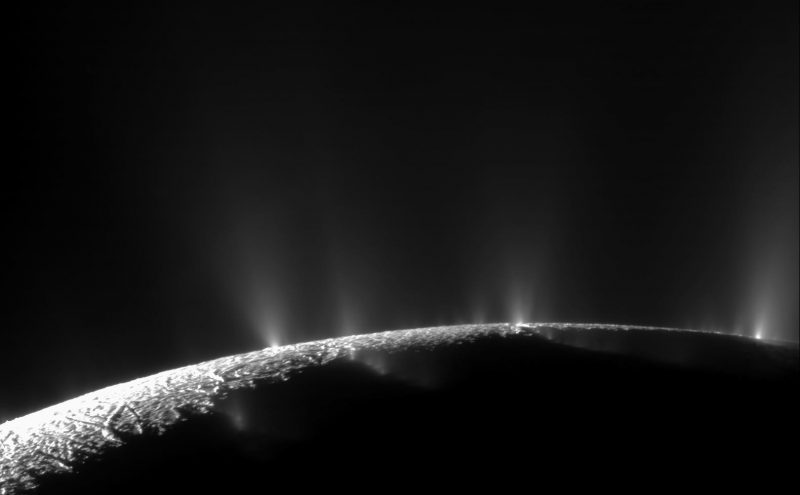
The geysers of Saturn’s moon Enceladus. These huge plumes of water vapor erupt through cracks at Enceladus’ south pole. The Cassini spacecraft analyzed the plumes and found they contain water vapor, ice particles, salts, methane and a variety of complex organic molecules. Scientists believe they originate from an ocean below the moon’s icy crust. Image via NASA/JPL-Caltech/Space Science Institute.
Could there be life on Saturn’s moon Enceladus? The moon may be small, but it has a global water ocean beneath its icy surface, and scientists have speculated on whether there is anything alive in that deep, dark abyss. The Cassini spacecraft found that it is salty like oceans on Earth, contains abundant organic molecules, and that there is likely hydrothermal activity on the ocean bottom.
All of those are positive signs for habitability and now scientists have found another one: the ocean appears to be just the right age for optimal life-supporting conditions. The finding was announced by Marc Neveu, a research scientist at NASA’s Goddard Space Flight Center, on June 24, 2019, during a talk at the 2019 Astrobiology Science Conference (AbSciCon2019). The peer-reviewed results had also been previously published April 1, 2019, in the journal Nature Astronomy.
Enceladus’ ocean is now estimated to be 1 billion years old. This is an ideal age, in terms of life starting and evolving. If the ocean were too young, there wouldn’t have been enough time for different elements needed to mix together, but if it were too old, those chemical processes may have stopped already. The moon would’ve then reached a state of equilibrium, meaning that the reactions to sustain life wouldn’t take place any longer.
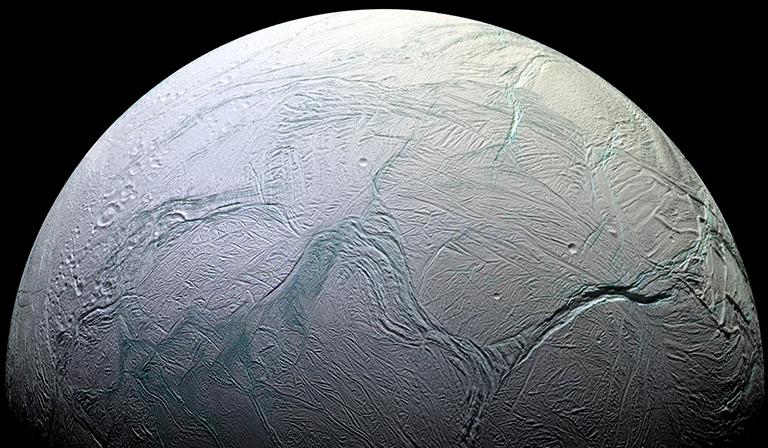
Enceladus as seen by the Cassini spacecraft. This small, icy moon has a global subsurface ocean that could possibly support life. Image via NASA/JPL-Caltech/NASA Science.
So how did Neveu and his team come to this conclusion? Using data from the Cassini mission, which ended in late 2017, they created 50 different simulations of conditions in Enceladus’ ocean. These included details of Saturn’s moons’ orbits and the radioactivity of the rocks on Enceladus, as well as their own estimates as to the age of the moon and how it formed.
There was one simulation that best re-created the known conditions of the ocean, the one where the ocean is 1 billion years old. Neveu is cautious, though, because the simulation matched most of the conditions, but not all of them:
For example, if you took the present day, the ocean would be refrozen in that simulation which is not what we’re seeing. So the age of the ocean, should be taken with a grain of salt.
As a next step, the researchers want to improve the simulation models, so the ocean can be dated more precisely. As Neveu said:
We want to know this before we go back to search for life.
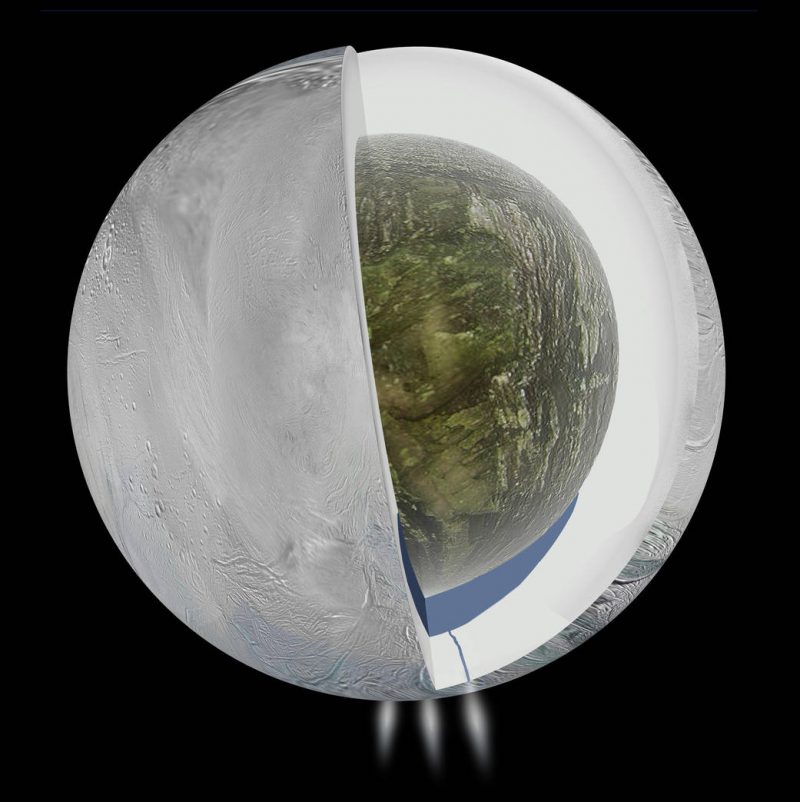
Illustration depicting the interior of Enceladus. Water from the subsurface ocean percolates to the surface through cracks in the ice at the south pole, erupting in huge plumes. Image via NASA/JPL-Caltech.
The fact that Enceladus has an ocean at all was surprising to planetary scientists, since it is so small and the surface is so cold. According to Neveu:
It’s very surprising to see an ocean today. It’s a very tiny moon and, in general, you expect tiny things to not be very active [but rather] like a dead block of rock and ice.
The Cassini spacecraft studied the composition of the ocean by analyzing the water vapor in the massive plumes that erupt from the moon’s south pole. The plumes originate from the ocean below, where water percolates to the surface through cracks, and then erupts into empty space. Cassini was able to fly right through the plumes, and found they contain water vapor, ice particles, salts, methane and a variety of complex organic molecules.
Cassini also found evidence for current hydrothermal activity – hydrothermal vents – on the ocean floor, just like in oceans on Earth. Such hotspots could provide an oasis of needed heat and energy in the otherwise cold waters. On Earth, similar vents sustain a wide variety of simple life forms. Could the same be true for Enceladus?
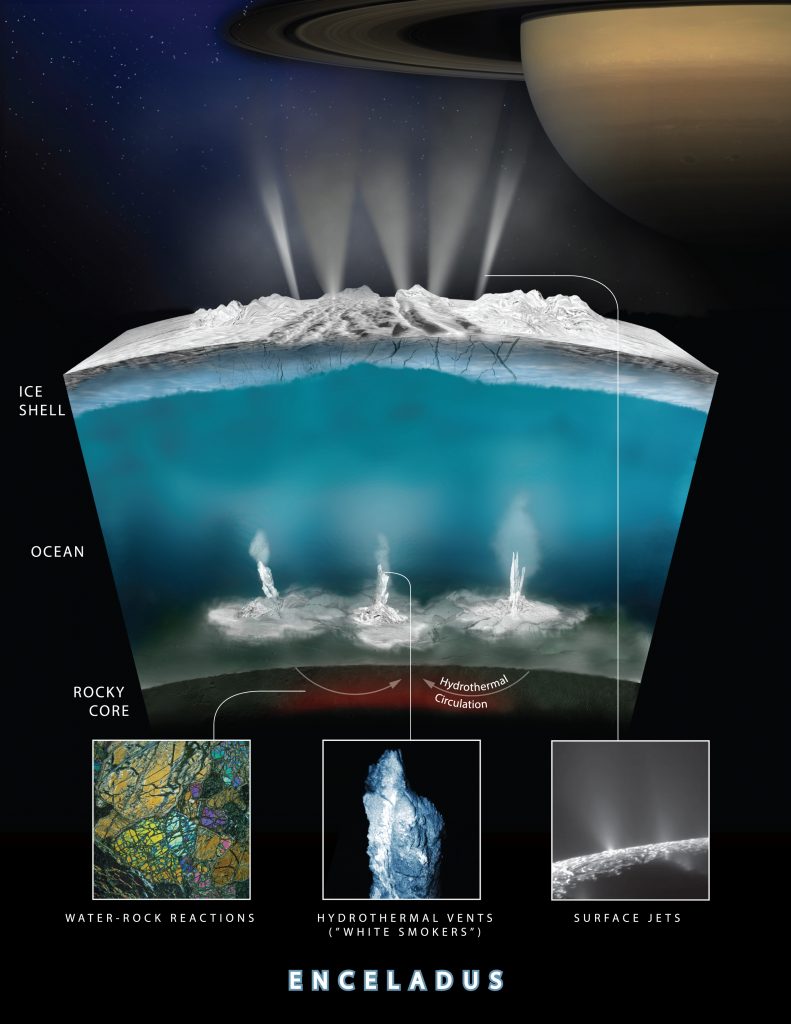
The Cassini mission found evidence for hydrothermal activity – hydrothermal vents – on the bottom of Enceladus’ ocean. Could they help sustain life like they do on Earth? Image via NASA/JPL-Caltech/Southwest Research Institute.
Enceladus has all the ingredients considered necessary for life (as we know it at least), and its ocean appears to be quite similar to that of Europa. Whether life of any kind ever actually started here is still unknown, but the prospects seem promising. The only way we can learn more is to go back there with a return mission. None are scheduled yet, but there are mission proposals on the drawing boards, perhaps something similar to the Europa Clipper mission, which is now being designed to launch sometime in the 2020s. That mission will study Europa and its ocean in more detail than ever before, looking for evidence that something might be alive in its dark waters as well.
Bottom line: It turns out that Enceladus’ subsurface ocean is just the right age to support life, according to a new study. Together with what we already know about its potential habitability, this makes Enceladus even more enticing in the search for life elsewhere in the solar system.
Source: Evolution of Saturn’s mid-sized moons
from EarthSky https://ift.tt/2NWpTD9
The geysers of Saturn’s moon Enceladus. These huge plumes of water vapor erupt through cracks at Enceladus’ south pole. The Cassini spacecraft analyzed the plumes and found they contain water vapor, ice particles, salts, methane and a variety of complex organic molecules. Scientists believe they originate from an ocean below the moon’s icy crust. Image via NASA/JPL-Caltech/Space Science Institute.
Could there be life on Saturn’s moon Enceladus? The moon may be small, but it has a global water ocean beneath its icy surface, and scientists have speculated on whether there is anything alive in that deep, dark abyss. The Cassini spacecraft found that it is salty like oceans on Earth, contains abundant organic molecules, and that there is likely hydrothermal activity on the ocean bottom.
All of those are positive signs for habitability and now scientists have found another one: the ocean appears to be just the right age for optimal life-supporting conditions. The finding was announced by Marc Neveu, a research scientist at NASA’s Goddard Space Flight Center, on June 24, 2019, during a talk at the 2019 Astrobiology Science Conference (AbSciCon2019). The peer-reviewed results had also been previously published April 1, 2019, in the journal Nature Astronomy.
Enceladus’ ocean is now estimated to be 1 billion years old. This is an ideal age, in terms of life starting and evolving. If the ocean were too young, there wouldn’t have been enough time for different elements needed to mix together, but if it were too old, those chemical processes may have stopped already. The moon would’ve then reached a state of equilibrium, meaning that the reactions to sustain life wouldn’t take place any longer.
Enceladus as seen by the Cassini spacecraft. This small, icy moon has a global subsurface ocean that could possibly support life. Image via NASA/JPL-Caltech/NASA Science.
So how did Neveu and his team come to this conclusion? Using data from the Cassini mission, which ended in late 2017, they created 50 different simulations of conditions in Enceladus’ ocean. These included details of Saturn’s moons’ orbits and the radioactivity of the rocks on Enceladus, as well as their own estimates as to the age of the moon and how it formed.
There was one simulation that best re-created the known conditions of the ocean, the one where the ocean is 1 billion years old. Neveu is cautious, though, because the simulation matched most of the conditions, but not all of them:
For example, if you took the present day, the ocean would be refrozen in that simulation which is not what we’re seeing. So the age of the ocean, should be taken with a grain of salt.
As a next step, the researchers want to improve the simulation models, so the ocean can be dated more precisely. As Neveu said:
We want to know this before we go back to search for life.
Illustration depicting the interior of Enceladus. Water from the subsurface ocean percolates to the surface through cracks in the ice at the south pole, erupting in huge plumes. Image via NASA/JPL-Caltech.
The fact that Enceladus has an ocean at all was surprising to planetary scientists, since it is so small and the surface is so cold. According to Neveu:
It’s very surprising to see an ocean today. It’s a very tiny moon and, in general, you expect tiny things to not be very active [but rather] like a dead block of rock and ice.
The Cassini spacecraft studied the composition of the ocean by analyzing the water vapor in the massive plumes that erupt from the moon’s south pole. The plumes originate from the ocean below, where water percolates to the surface through cracks, and then erupts into empty space. Cassini was able to fly right through the plumes, and found they contain water vapor, ice particles, salts, methane and a variety of complex organic molecules.
Cassini also found evidence for current hydrothermal activity – hydrothermal vents – on the ocean floor, just like in oceans on Earth. Such hotspots could provide an oasis of needed heat and energy in the otherwise cold waters. On Earth, similar vents sustain a wide variety of simple life forms. Could the same be true for Enceladus?
The Cassini mission found evidence for hydrothermal activity – hydrothermal vents – on the bottom of Enceladus’ ocean. Could they help sustain life like they do on Earth? Image via NASA/JPL-Caltech/Southwest Research Institute.
Enceladus has all the ingredients considered necessary for life (as we know it at least), and its ocean appears to be quite similar to that of Europa. Whether life of any kind ever actually started here is still unknown, but the prospects seem promising. The only way we can learn more is to go back there with a return mission. None are scheduled yet, but there are mission proposals on the drawing boards, perhaps something similar to the Europa Clipper mission, which is now being designed to launch sometime in the 2020s. That mission will study Europa and its ocean in more detail than ever before, looking for evidence that something might be alive in its dark waters as well.
Bottom line: It turns out that Enceladus’ subsurface ocean is just the right age to support life, according to a new study. Together with what we already know about its potential habitability, this makes Enceladus even more enticing in the search for life elsewhere in the solar system.
Source: Evolution of Saturn’s mid-sized moons
from EarthSky https://ift.tt/2NWpTD9