Editor’s Note: Guy Ottewell’s book – Uranus, Neptune, Pluto: A Longer View – looks at least a dozen years ahead. There are 73 short chapters, plus Ottewell’s unique and beautiful charts. You can order the book here. The following article was originally posted at Guy Ottewell’s blog in 2018. Reprinted here with permission.
My original announcement of my book was rather curt, so Deborah Byrd – editor-in-chief at EarthSky.org – has asked me to say more about it.
Well. I produced my Astronomical Calendar for many a year, and, every year, as I labored through each task, such as the section on one of the planets – making the calculations, choosing the limits for the chart, choosing among the remarks that could be made and the other features that space might allow – I found myself mostly pouring material into a mold, even if with improvements. It occurred to me that I would rather be making charts for many years ahead. Then instead of just mentioning that Mars’s path for the year is part of a two-year pattern, or Venus’s is part of an eight-year pattern or Jupiter’s of a 12-year pattern, I could show the patterns whole.
So now, instead of the annual book, I hope to make a series of Longer View books.
Why start with Uranus and Neptune, the “last” planets? Because, I thought, that would be quickest. I had featured them together in the Astronomical Calendar, because they were advancing in their stately way through the same region of the sky (around 1993 they could be shown in one chart). In various years, I thought of six or seven extra illustrations for them, such as a graph showing how Uranus overtakes Neptune every 172 years …
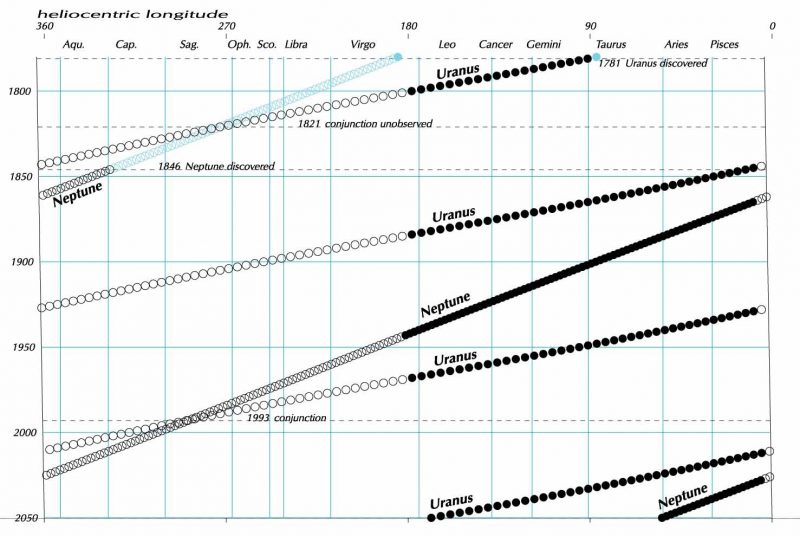
View larger. | Uranus overtakes Neptune, via Guy Ottewell.
And I could provide a diagram of Uranus spinning on its side …
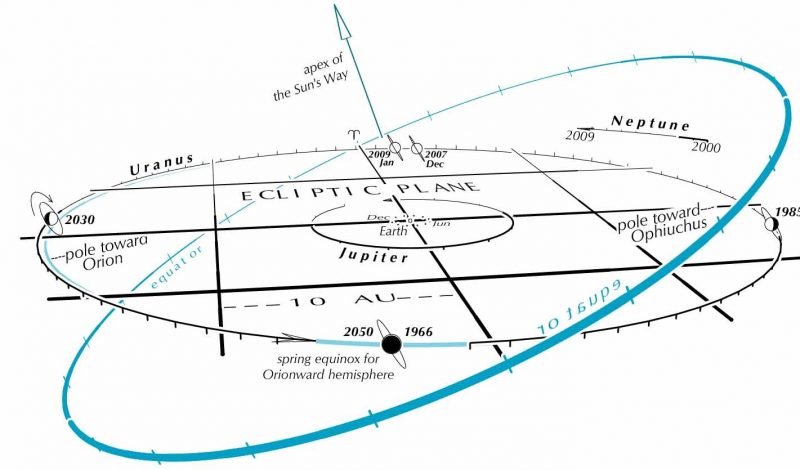
View larger. | Uranus spins on its side with respect to the plane of the solar system, via Guy Ottewell.
But, each year, I had to choose only one of these to fit into the page. In a Longer View book, there would be room for them all. And for remarks that needn’t be kept so brief.
And why include Pluto, no longer classed as a major planet? Because the discovery story, the story of the first additions to the ancient planet family, goes Uranus-Neptune-Pluto. Each led to the next. True, the story goes on to 1992 QB1 and Eris and the other transneptunians, but their discovery wasn’t the consequence of Pluto’s as Pluto’s was of Neptune’s and Neptune’s of Uranus’s. And though Pluto is far below visibility to the unaided eye, it is far higher in observability than the other transneptunians, all smaller or more remote. And there is now, because of the New Horizons spacecraft visit, much more to say about it; indeed, there is much more detail to it than to Uranus and Neptune.
I finished the book on June 1. I had expected to finish it some time back in 2017, when I started it, but there proved to be more of interest than I had expected. Writing about these bodies was like opening a series of closets and finding them as large as rooms, some leading to other rooms.
For instance, several of the twists in the story of why Neptune came to be discovered at Berlin and not at Cambridge are not quite as often told – the reason why Adams didn’t get a response to his knock at the Astronomer Royal’s door was that the Astronomer Royal’s beautiful wife was having a miscarriage; the reason why Le Verrier sent his prediction to Galle may have been that he guiltily owed him a letter.
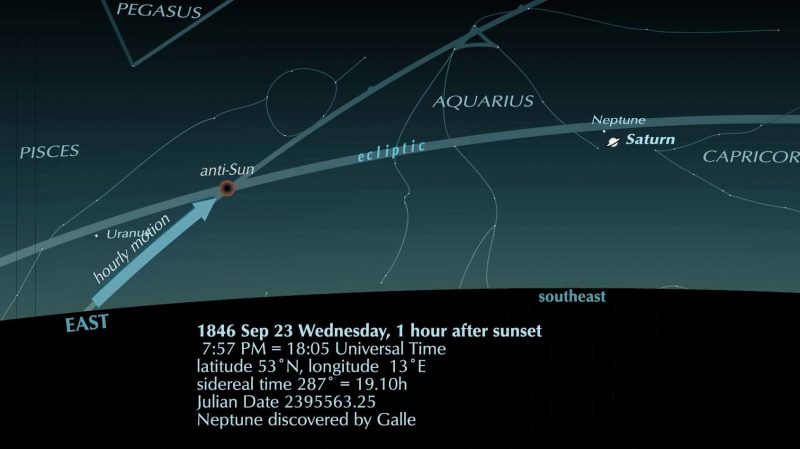
Chart showing the night sky on September 23, 1846, the night of Neptune’s discovery, via Guy Ottewell.
And in 1993, when Neptune for the first since its discovery was passed by Uranus, there was a highly improbable episode that most of us weren’t aware of: a conjunction that came within a celestial hairbreadth of happening but failed to happen …
This is how Uranus and Neptune would have looked if they had been at the same declination during their conjunction. Image via Guy Ottewell.
And there is what I call the Neptune-Pluto standoff: Pluto crosses over Neptune’s orbit (so that it was once suspected of being an escaped Neptune satellite); yet, in a sort of rigid geometrical ballet, it has always stayed as far from Neptune as it can – in fact, it comes nearer to Uranus.

View larger. | Pluto crosses Neptune’s orbit, but stays as far from Neptune as it can. Image via Guy Ottewell.
And there is the Pluto-Charon embrace: they are the nearest thing to being a double planet. They keep their same faces to each other as they rotate slowly around a common point (which, unlike that for the Earth-moon nearly-double-planet system, is not inside the larger body but is in the space between them); they exchange material with each other.
And: Uranus, as is well known, rotates on its side, which brings the whole concept of north into dispute. Meanwhile, Pluto’s spin axis is tilted even further.
Pluto spin axis. Image via Guy Ottewell.
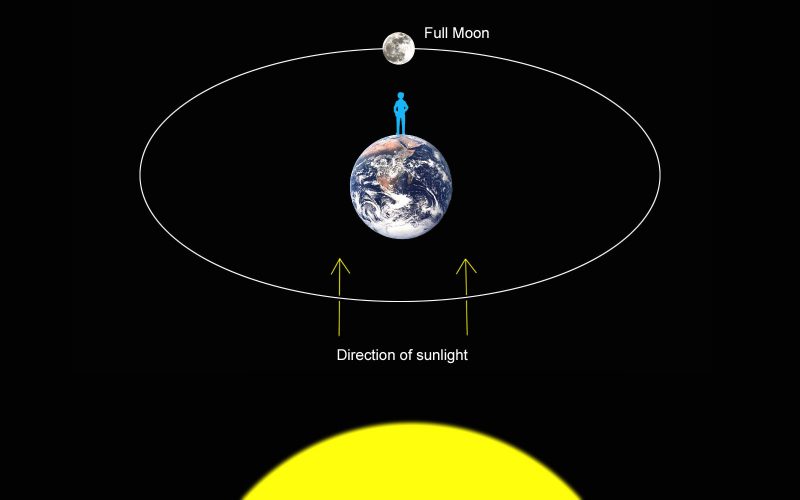
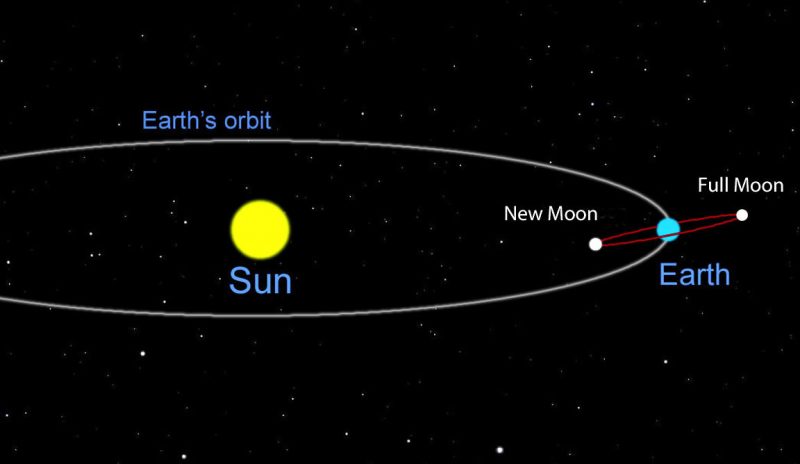
And, Uranus’s oppositions coincide with Earth’s new moon and full moon in alternate years – why?
And there are issues over not only titles like planet and dwarf planet but designations – 10000 Pluto vs. 134340 Pluto – and names – Georgium Sidus vs. Uranus, Ohnehtn vs. Pluto, Xena vs. Eris, Persephone vs. Charon. And there is this remark:
I’m not sure I would want to identify my wife with the janitor of hell.
I’m not sure that was a remark I should have made, but, being my own editor, I can venture bits of irreverence toward the scientists that a textbook writer would not get away with.
The book’s table of contents, shown before merely like a photo, appeared slightly indistinct, so click here to see it as a PDF, which should be as sharp as in print. The small images in it are only thumbnails of a few of those in the book. Here are some at fuller size.
View larger. | Paths of the outer solar planets, and some outbound spacecraft, via Guy Ottewell.
Spacecraft images of Uranus (l) and Neptune (r), via Guy Ottewell.
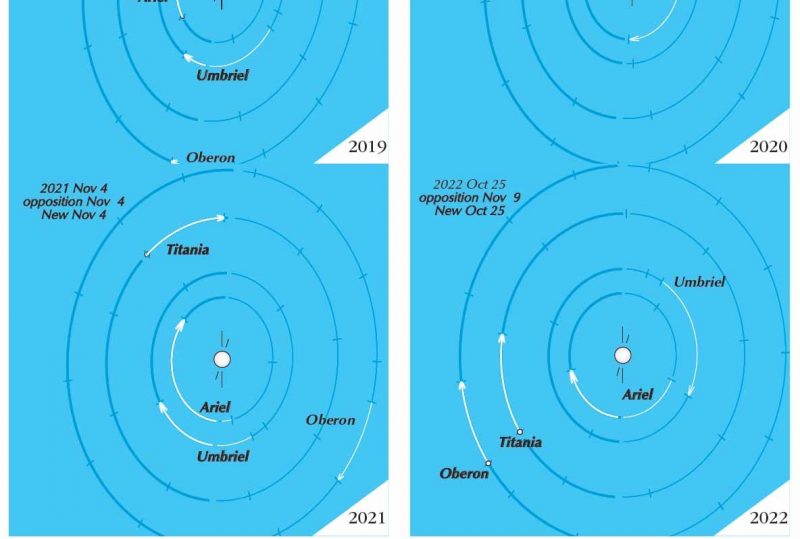
Uranus has 5 major moons: Miranda, Ariel, Umbriel, Titania, and Oberon. Image via Guy Ottewell.
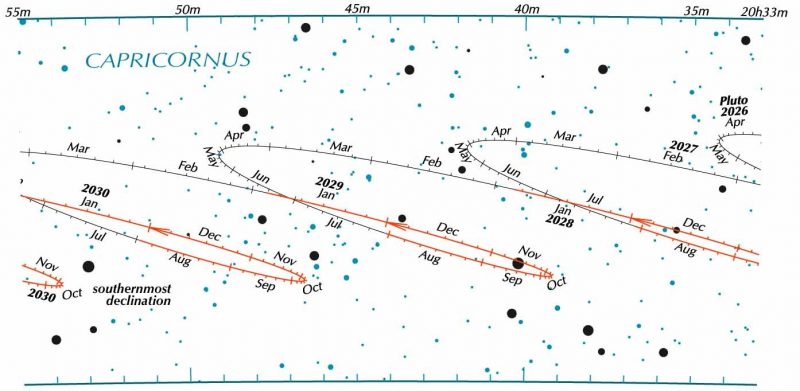
Pluto’s path in Earth’s sky, 2016-2030, via Guy Ottewell.
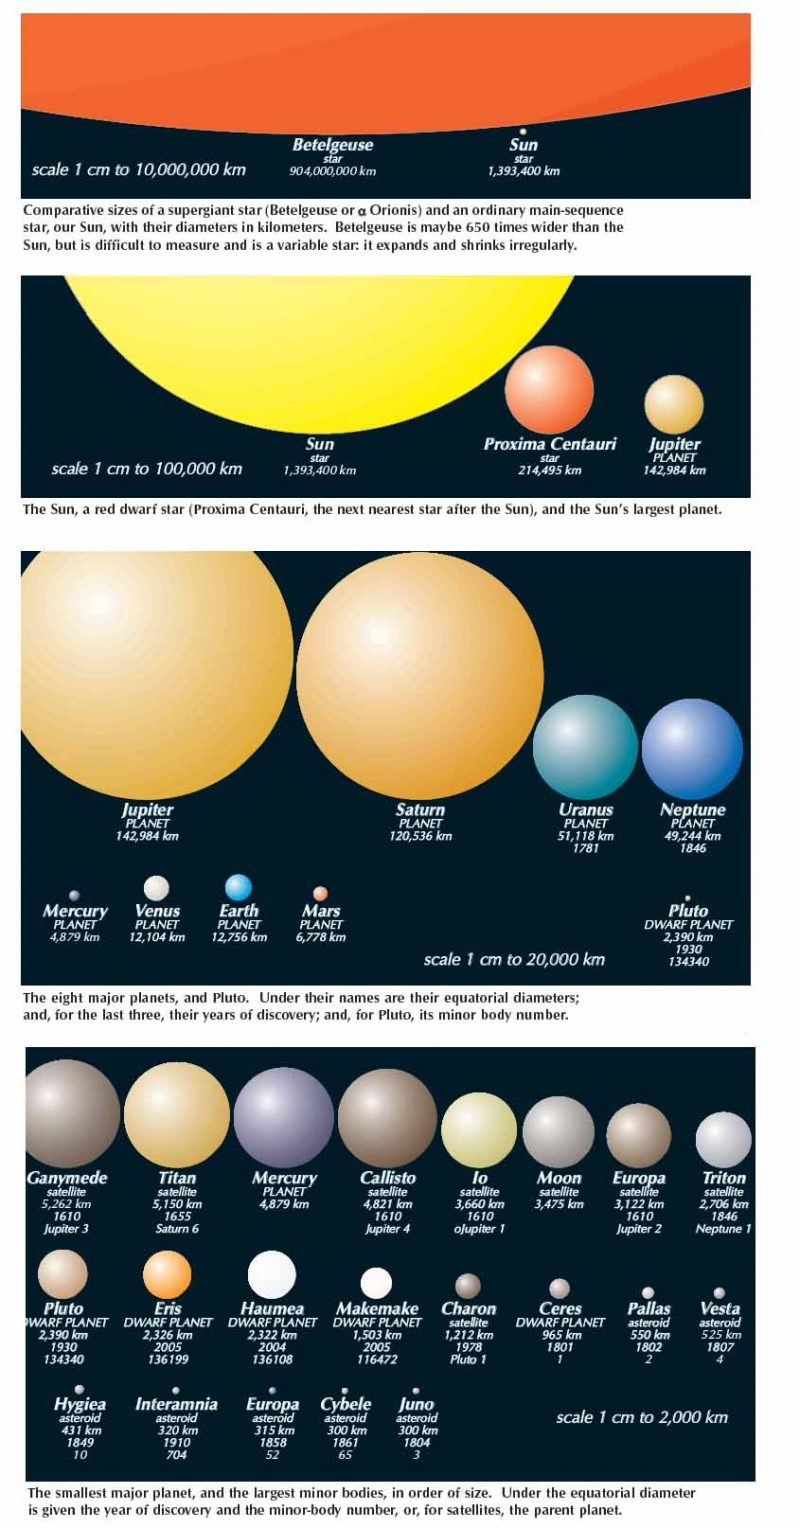
This isn’t a fruit salad but a (necessarily small) photo of pages 18-19, showing sizes on four different scales …
Bottom line: Astronomer Guy Ottewell describes his book titled Uranus, Neptune, Pluto: A Longer View. You can purchase the book from Amazon here.
from EarthSky https://ift.tt/2LMlC2u
Editor’s Note: Guy Ottewell’s book – Uranus, Neptune, Pluto: A Longer View – looks at least a dozen years ahead. There are 73 short chapters, plus Ottewell’s unique and beautiful charts. You can order the book here. The following article was originally posted at Guy Ottewell’s blog in 2018. Reprinted here with permission.
My original announcement of my book was rather curt, so Deborah Byrd – editor-in-chief at EarthSky.org – has asked me to say more about it.
Well. I produced my Astronomical Calendar for many a year, and, every year, as I labored through each task, such as the section on one of the planets – making the calculations, choosing the limits for the chart, choosing among the remarks that could be made and the other features that space might allow – I found myself mostly pouring material into a mold, even if with improvements. It occurred to me that I would rather be making charts for many years ahead. Then instead of just mentioning that Mars’s path for the year is part of a two-year pattern, or Venus’s is part of an eight-year pattern or Jupiter’s of a 12-year pattern, I could show the patterns whole.
So now, instead of the annual book, I hope to make a series of Longer View books.
Why start with Uranus and Neptune, the “last” planets? Because, I thought, that would be quickest. I had featured them together in the Astronomical Calendar, because they were advancing in their stately way through the same region of the sky (around 1993 they could be shown in one chart). In various years, I thought of six or seven extra illustrations for them, such as a graph showing how Uranus overtakes Neptune every 172 years …
View larger. | Uranus overtakes Neptune, via Guy Ottewell.
And I could provide a diagram of Uranus spinning on its side …
View larger. | Uranus spins on its side with respect to the plane of the solar system, via Guy Ottewell.
But, each year, I had to choose only one of these to fit into the page. In a Longer View book, there would be room for them all. And for remarks that needn’t be kept so brief.
And why include Pluto, no longer classed as a major planet? Because the discovery story, the story of the first additions to the ancient planet family, goes Uranus-Neptune-Pluto. Each led to the next. True, the story goes on to 1992 QB1 and Eris and the other transneptunians, but their discovery wasn’t the consequence of Pluto’s as Pluto’s was of Neptune’s and Neptune’s of Uranus’s. And though Pluto is far below visibility to the unaided eye, it is far higher in observability than the other transneptunians, all smaller or more remote. And there is now, because of the New Horizons spacecraft visit, much more to say about it; indeed, there is much more detail to it than to Uranus and Neptune.
I finished the book on June 1. I had expected to finish it some time back in 2017, when I started it, but there proved to be more of interest than I had expected. Writing about these bodies was like opening a series of closets and finding them as large as rooms, some leading to other rooms.
For instance, several of the twists in the story of why Neptune came to be discovered at Berlin and not at Cambridge are not quite as often told – the reason why Adams didn’t get a response to his knock at the Astronomer Royal’s door was that the Astronomer Royal’s beautiful wife was having a miscarriage; the reason why Le Verrier sent his prediction to Galle may have been that he guiltily owed him a letter.
Chart showing the night sky on September 23, 1846, the night of Neptune’s discovery, via Guy Ottewell.
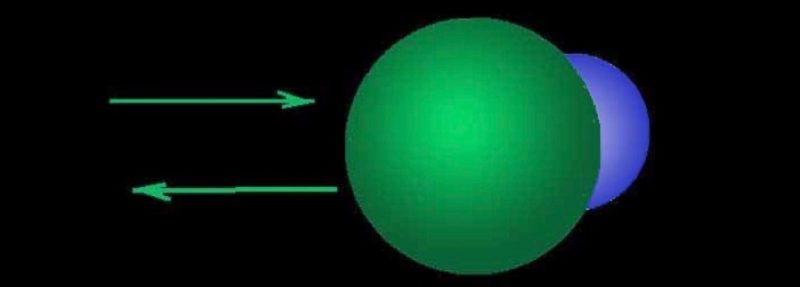
And in 1993, when Neptune for the first since its discovery was passed by Uranus, there was a highly improbable episode that most of us weren’t aware of: a conjunction that came within a celestial hairbreadth of happening but failed to happen …
This is how Uranus and Neptune would have looked if they had been at the same declination during their conjunction. Image via Guy Ottewell.
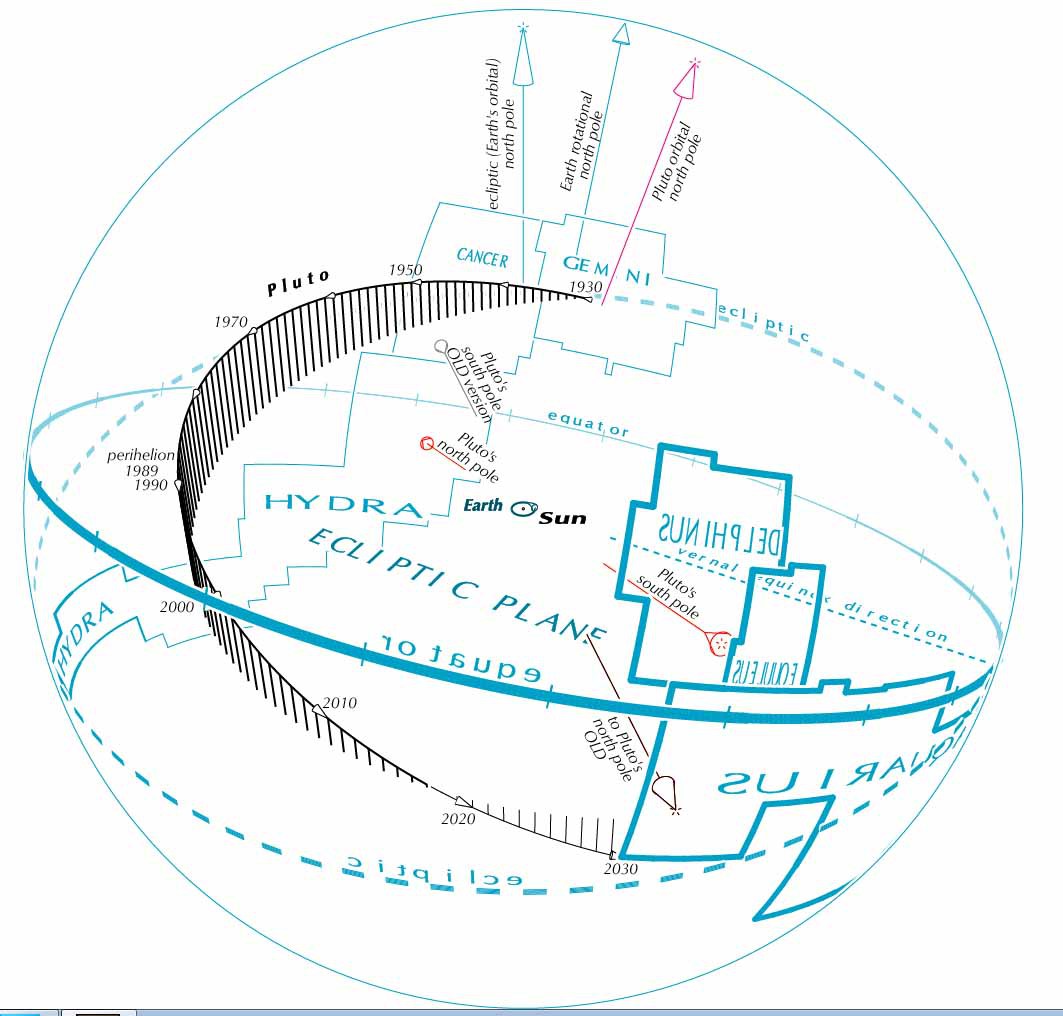
And there is what I call the Neptune-Pluto standoff: Pluto crosses over Neptune’s orbit (so that it was once suspected of being an escaped Neptune satellite); yet, in a sort of rigid geometrical ballet, it has always stayed as far from Neptune as it can – in fact, it comes nearer to Uranus.
View larger. | Pluto crosses Neptune’s orbit, but stays as far from Neptune as it can. Image via Guy Ottewell.
And there is the Pluto-Charon embrace: they are the nearest thing to being a double planet. They keep their same faces to each other as they rotate slowly around a common point (which, unlike that for the Earth-moon nearly-double-planet system, is not inside the larger body but is in the space between them); they exchange material with each other.
And: Uranus, as is well known, rotates on its side, which brings the whole concept of north into dispute. Meanwhile, Pluto’s spin axis is tilted even further.
Pluto spin axis. Image via Guy Ottewell.
And, Uranus’s oppositions coincide with Earth’s new moon and full moon in alternate years – why?
And there are issues over not only titles like planet and dwarf planet but designations – 10000 Pluto vs. 134340 Pluto – and names – Georgium Sidus vs. Uranus, Ohnehtn vs. Pluto, Xena vs. Eris, Persephone vs. Charon. And there is this remark:
I’m not sure I would want to identify my wife with the janitor of hell.
I’m not sure that was a remark I should have made, but, being my own editor, I can venture bits of irreverence toward the scientists that a textbook writer would not get away with.
The book’s table of contents, shown before merely like a photo, appeared slightly indistinct, so click here to see it as a PDF, which should be as sharp as in print. The small images in it are only thumbnails of a few of those in the book. Here are some at fuller size.
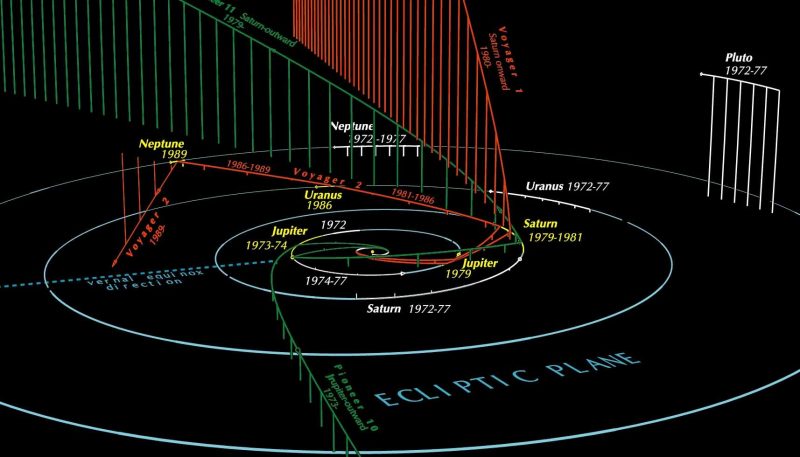
View larger. | Paths of the outer solar planets, and some outbound spacecraft, via Guy Ottewell.
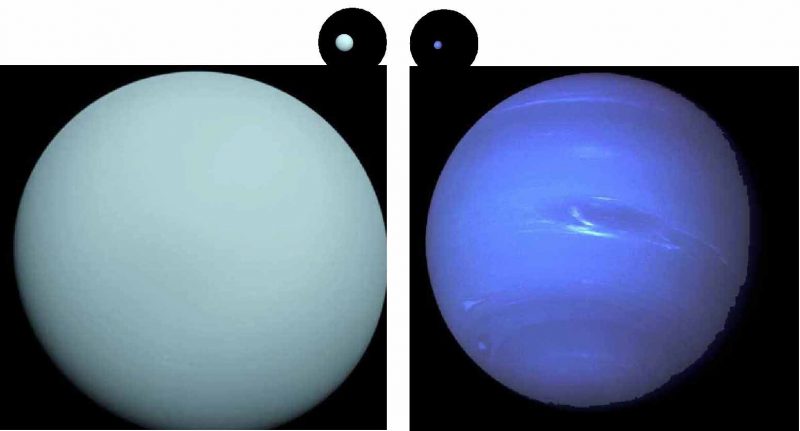
Spacecraft images of Uranus (l) and Neptune (r), via Guy Ottewell.
Uranus has 5 major moons: Miranda, Ariel, Umbriel, Titania, and Oberon. Image via Guy Ottewell.
Pluto’s path in Earth’s sky, 2016-2030, via Guy Ottewell.
This isn’t a fruit salad but a (necessarily small) photo of pages 18-19, showing sizes on four different scales …
Bottom line: Astronomer Guy Ottewell describes his book titled Uranus, Neptune, Pluto: A Longer View. You can purchase the book from Amazon here.
from EarthSky https://ift.tt/2LMlC2u