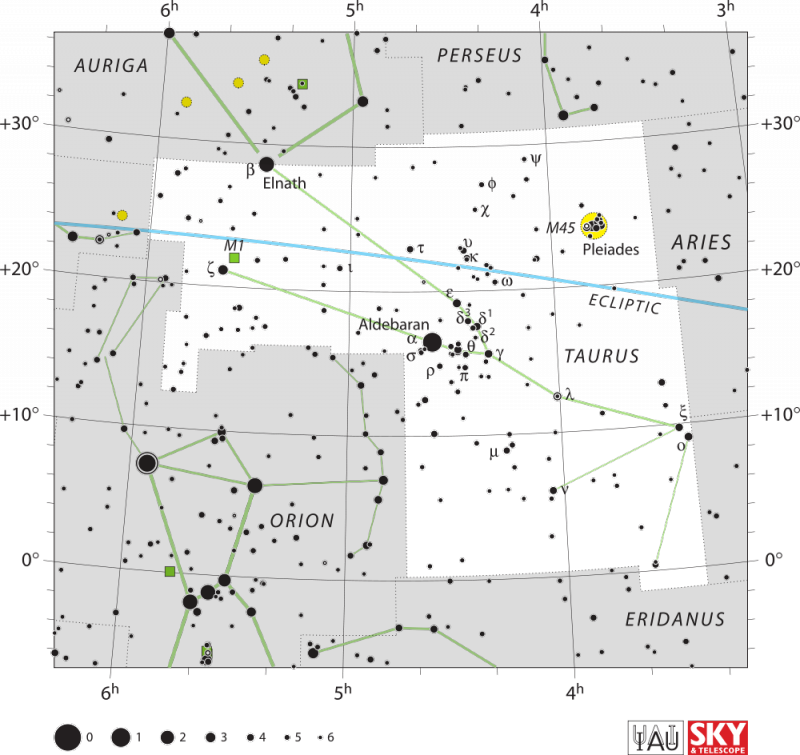
The moon is soon to swing by the Pleiades star cluster and star Aldebaran, which rank as the two most prominent signposts in the constellation Taurus the Bull. The moon swings to the south of the Pleiades cluster on June 29, 2019, and then to the north of Aldebaran on June 30, 2019. Finally, the moon will meet up with the planet Venus in the glow of morning dawn on or near July 1, 2019.
Here’s the tricky part of this observation. You probably won’t see all of the aforementioned objects at the same time. By the time that Venus rises into your sky, chances are the Pleiades star cluster and Aldebaran will have faded from sight in the glare of morning twilight. Venus, like the moon, also shines in front of the constellation Taurus in late June and early July 2019.
However, the moon will move out of the constellation Taurus and into the constellation Gemini on or near July 2. Then, Venus too will move out of of Taurus and into Gemini, on or near July 4.
The chart below shows the moon’s movement in late June and early July with respect to Venus. Will you see the star Aldebaran in the morning twilight, at the same time as Venus? Maybe. Venus is much, much brighter. Both Aldebaran and Venus will be near the sunrise, so you’ll need an unobstructed horizon to see them. Binoculars might help, too!
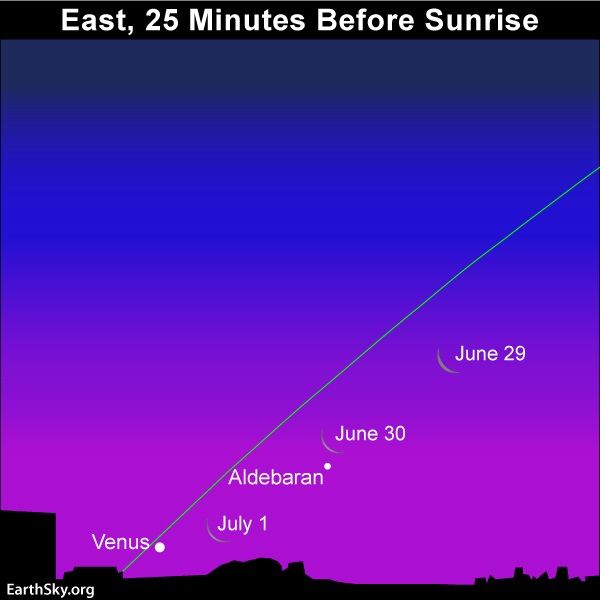
It’ll be a big challenge to catch the star Aldebaran and the planet Venus before sunrise in late June and early July 2019.
The Pleiades star cluster – a tiny, misty dipper in a dark-enough sky – is fainter still. You’ll probably need to be up before dawn’s first light, to see the Pleiades with the eye alone. Astronomers have a special name for dawn’s first light; it’s the same name they use for the last traces of evening twilight. They call it astronomical twilight. Want to know when astronomical twilight arrives in your sky? Click here and check the astronomical twilight box.
Want to know when the moon rises into your sky? Click here and check the moonrise and moonset box.
To find out the rising time of Aldebaran, click here and choose Aldebaran as your celestial object of interest.
We in the Northern Hemisphere tend to associate the constellation Taurus with the winter season because that’s when this constellation comes at nightfall and beautifies our winter nights. If you live in the Southern Hemisphere, then the constellation Taurus lights up your summer evenings.
The sun passes in front of the constellation Taurus each year from about May 14 to June 21, at which time this constellation is lost in the sun’s glare. Taurus is just beginning to make its return to the morning sky in late June and early July.
Despite the hot weather in the Northern Hemisphere at present, the first inklings of winter season – the constellation Taurus – can now be seen before sunrise. (Or if you live in the Southern Hemisphere, Taurus’ initial morning appearance signals the inevitable coming of summer.) Because the stars rise some four minutes earlier daily, or 1/2 hour earlier weekly or two hours earlier monthly, the constellation Taurus the Bull’s presence in the morning sky will become more prominent with each passing month.
By the middle of November, the Pleiades cluster will be out all night long; and by around December 1, the star Aldebaran will put on its all-night appearance. The all-night appearances of the Pleiades cluster and then the star Aldebaran some two weeks later signal that late autumn is soon to give way to winter in the Northern Hemisphere.
Bottom line: On these late June and early July mornings, let the waning crescent moon serve as your guide to the constellation Taurus’ two major signposts: the Pleiades star cluster and the red giant star, Aldebaran. Wait just before sunrise, and you’ll see Venus rise over your eastern horizon, too.
from EarthSky https://ift.tt/2IVlwnn
The moon is soon to swing by the Pleiades star cluster and star Aldebaran, which rank as the two most prominent signposts in the constellation Taurus the Bull. The moon swings to the south of the Pleiades cluster on June 29, 2019, and then to the north of Aldebaran on June 30, 2019. Finally, the moon will meet up with the planet Venus in the glow of morning dawn on or near July 1, 2019.
Here’s the tricky part of this observation. You probably won’t see all of the aforementioned objects at the same time. By the time that Venus rises into your sky, chances are the Pleiades star cluster and Aldebaran will have faded from sight in the glare of morning twilight. Venus, like the moon, also shines in front of the constellation Taurus in late June and early July 2019.
However, the moon will move out of the constellation Taurus and into the constellation Gemini on or near July 2. Then, Venus too will move out of of Taurus and into Gemini, on or near July 4.
The chart below shows the moon’s movement in late June and early July with respect to Venus. Will you see the star Aldebaran in the morning twilight, at the same time as Venus? Maybe. Venus is much, much brighter. Both Aldebaran and Venus will be near the sunrise, so you’ll need an unobstructed horizon to see them. Binoculars might help, too!
It’ll be a big challenge to catch the star Aldebaran and the planet Venus before sunrise in late June and early July 2019.
The Pleiades star cluster – a tiny, misty dipper in a dark-enough sky – is fainter still. You’ll probably need to be up before dawn’s first light, to see the Pleiades with the eye alone. Astronomers have a special name for dawn’s first light; it’s the same name they use for the last traces of evening twilight. They call it astronomical twilight. Want to know when astronomical twilight arrives in your sky? Click here and check the astronomical twilight box.
Want to know when the moon rises into your sky? Click here and check the moonrise and moonset box.
To find out the rising time of Aldebaran, click here and choose Aldebaran as your celestial object of interest.
We in the Northern Hemisphere tend to associate the constellation Taurus with the winter season because that’s when this constellation comes at nightfall and beautifies our winter nights. If you live in the Southern Hemisphere, then the constellation Taurus lights up your summer evenings.
The sun passes in front of the constellation Taurus each year from about May 14 to June 21, at which time this constellation is lost in the sun’s glare. Taurus is just beginning to make its return to the morning sky in late June and early July.
Despite the hot weather in the Northern Hemisphere at present, the first inklings of winter season – the constellation Taurus – can now be seen before sunrise. (Or if you live in the Southern Hemisphere, Taurus’ initial morning appearance signals the inevitable coming of summer.) Because the stars rise some four minutes earlier daily, or 1/2 hour earlier weekly or two hours earlier monthly, the constellation Taurus the Bull’s presence in the morning sky will become more prominent with each passing month.
By the middle of November, the Pleiades cluster will be out all night long; and by around December 1, the star Aldebaran will put on its all-night appearance. The all-night appearances of the Pleiades cluster and then the star Aldebaran some two weeks later signal that late autumn is soon to give way to winter in the Northern Hemisphere.
Bottom line: On these late June and early July mornings, let the waning crescent moon serve as your guide to the constellation Taurus’ two major signposts: the Pleiades star cluster and the red giant star, Aldebaran. Wait just before sunrise, and you’ll see Venus rise over your eastern horizon, too.
from EarthSky https://ift.tt/2IVlwnn