This is a re-post from Carbon Brief by Daisy Dunne
The record-breaking 2018 summer heatwave in Japan in which more than 1,000 people died “could not have happened without human-induced global warming”, a study finds.
And the extreme heat felt in Japan last summer could “become a usual situation” within the next few decades as temperatures continue to rise, the authors say.
The research is the latest in “attribution science”, a field that aims to quantify the “fingerprint” of climate change on extreme weather events, such as heatwaves, floods and droughts.
It follows analysis published in December which found that climate change made the UK 2018 summer heatwave up to 30 times more likely.
The study is “very interesting”, but requires “further confirmation” before its conclusions can be fully accepted, a leading attribution scientist tells Carbon Brief.
Red hot
Last year’s summer heatwave across many parts of the Northern Hemisphere made headlines worldwide. The heat broke temperature records from Belfast to Denver and drove wildfires in places such as Sweden, Greece and California.
In Japan, temperatures reached a record high of 41.1C in July. Early reports at the time suggested that dozens had died in the record-breaking weather. The Japanese government later reported that 1,032 people died during the month-long period.
The new study assesses the extent to which human-caused climate change could have boosted the odds of such a heatwave occuring. The results are published in Scientific Online Letters on the Atmosphere, a journal published by the Meteorological Society of Japan.
It also assesses the extent to which natural changes to the weather could have influenced the odds of such a heatwave.
At the time of the heatwave, Japan experienced a “two-tiered high-pressure system”. High-pressure systems move slowly over land, often causing persistent hot and dry conditions.
During the event, two high-pressure systems were stacked on top of each other in the troposphere, explains study lead author Dr Yukiko Imada, a senior researcher at the Japan Meteorological Agency. She tells Carbon Brief:
“A high-pressure system brings descending flows and raises the temperature. [Intense] sunshine also helps to raise the temperature. Last year, those two high pressure systems were stronger and expanded over Japan.”
Another world
To work out the extent to which global warming could have boosted the chances of such a heatwave, the authors used a climate model to compare the chances of the heatwave happening in today’s world to a hypothetical world without climate change.
To do this, the researchers produced two sets of simulations. The first set included many of the factors that can influence the climate, including human-driven greenhouse gases, volcanic eruptions and solar variability. The second set included all of these factors except for human-driven greenhouse gases.
The researchers then studied the simulations to see how often heatwaves on the same scale to that seen in 2018 occur in both the “real” world and the world without global warming.
They found that, in today’s world, a heatwave on the scale of that seen in 2018 has around a one-in-five chance of occuring. However, in a world without climate change, such a heatwave would have almost no chance of occuring, says Imada:
“Surprisingly, under the climate without global warming, the event probability reduced to almost zero. That is [to say], the last-year event could not have happened without global warming.”
The map below, which is taken from the study, gives a breakdown of the results at different points across Japan.
The map shows the difference in the number of extremely hot days expected in July in today’s world and a world without climate change across Japan. For example, red areas are found to experience up to eight more extremely hot days in July in today’s world than in a world without climate change.
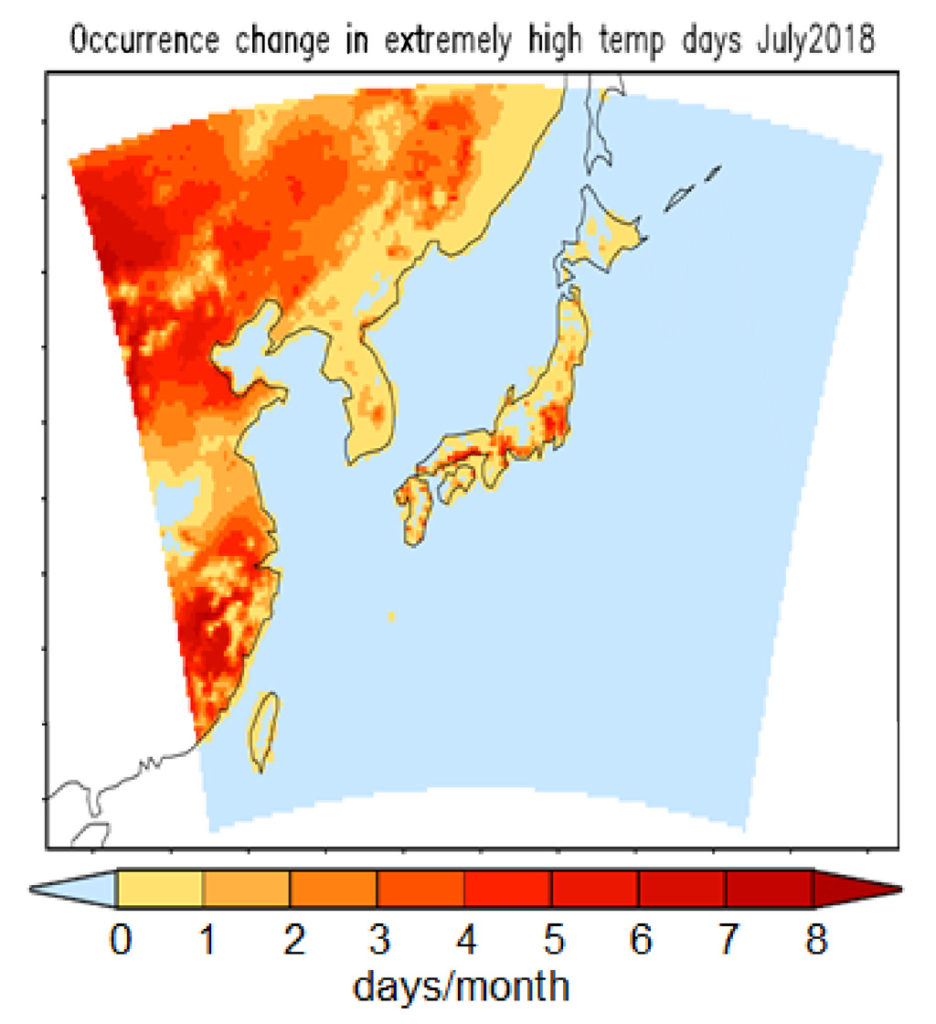
The difference in the number of extremely hot days expected in July in today’s world and a world without climate change across Japan. Yellow indicates little to no difference in the number of hot days in today’s world and a world without climate change, while red indicates a difference of up to eight days. (The map also includes parts of eastern China, Russia and North and South Korea.) Source: Imada et al. (2019)
The map shows that global warming has caused “a pronounced increase in extremely hot days in the populated areas of Japan”, including Tokyo, the authors say in their research paper.
Warming’s fingerprint
The researchers also used statistical methods to study how the two-tiered high-pressure system could have influenced the odds of such a heatwave.
They find that the weather system at least doubled the chances of such extreme heat occuring.
The chart below, which is taken from the study, gives a picture of how both global warming and the two-tiered high-pressure system influenced the odds of such a heatwave.
The chart shows a range of probability curves (also known as PDFs). The blue curve shows the probability of such a heatwave in the “non-warming” world – a world without human-driven climate change – while the red curve shows the probability in a world with climate change.
In addition to this, the pink curve shows the probability in today’s world when the chance of a two-tiered high-pressure system is also included, while the orange curve shows the probability when the weather system is not included. The black line shows the actual data from 2018.
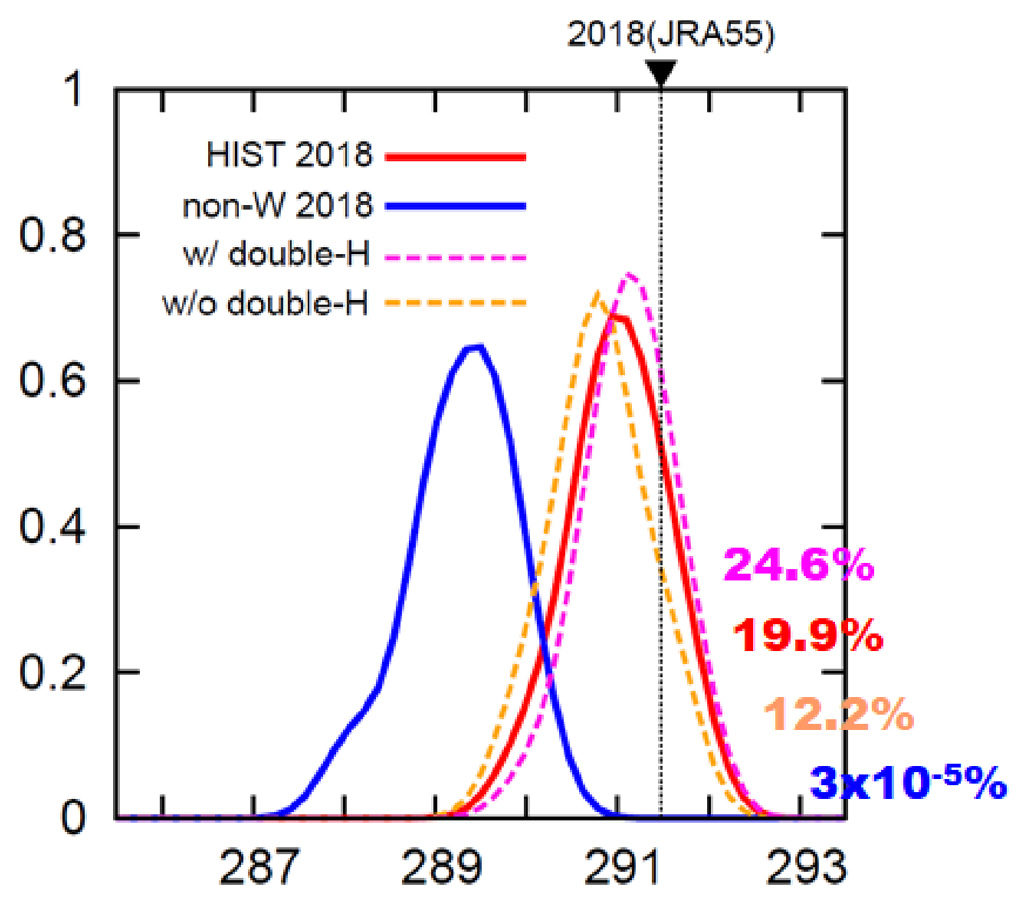
Probability curves (PDFs) of the chances of a heatwave on the same scale to that seen in Japan in 2018 in a world without global warming (blue), a world with global warming (red), a world with global warming and “two-tiered high-pressure systems” (pink) and a world with global warming and without two-tiered high-pressure systems. The black line shows the actual data from 2018. Source: Imada et al. (2019)
The chart shows that, in today’s world, such a heatwave has around a one-in-five (19.9%) chance of happening. This rises to around a one-in-four chance (24.6%) when the chances of a two-tiered high-pressure weather system are also factored in.
The chances of such a heatwave happening a world without global warming are so small as to be almost negligible, the chart shows.
The authors also made projections for the future. They find that if global warming is limited to 1.5C above pre-industrial levels – the aspirational goal of the Paris Agreement – the average area in Japan could experience around 3.6 extremely hot July days per year. (Japan’s average area currently experiences 2.7 hot July days per year.)
If warming reaches 2C, the number of extremely hot July days per year could rise to 4.8, the authors add.
‘Preliminary result’
The findings are the “latest in a series of studies” that show that “some temperature extremes at country level would be essentially impossible were it not for the effects of human-induced climate change”, says Prof Peter Stott, a leading attribution scientist from the Met Office Hadley Centre, who was not involved in the study. He tells Carbon Brief:
“Their conclusion that the heatwave event ‘would never have happened without anthropogenic global warming’ does depend heavily on the reliability of the model they use. In particular, it depends on the mean human-induced temperature change for Japan that they calculate from the model – which they estimate to be almost 2C.
“The reliability of the model is little discussed in the paper so it is hard to know whether the model is accurately representing temperature changes and variability in Japan. For that reason, I would say that this is a very interesting preliminary result that needs further confirmation before we could be confident that such extreme temperatures really would be impossible without climate change.”
It may be too soon to conclude that such a heatwave would not have occurred without climate change, but the study’s results do fit well with the global picture of how climate change is influencing heatwaves, adds Prof Sonia Seneviratne, a researcher of climate extremes from ETH Zurich. She tells Carbon Brief:
“Because the results are based on a single model and on a finite, but large, number of simulations, we cannot fully exclude at the moment that a single realisation with a different model could display such extreme conditions in Japan under pre-industrial climate conditions.
“But this seems extremely unlikely given the large temperature anomalies that were observed in the country – and given the very large and demonstrated effects of increasing CO2 in amplifying temperature extremes across the world. This is even less likely when considering the event in the context of all the heatwaves that occurred in the northern hemisphere during that summer.”
Imada, Y. et al. (2019) The July 2018 high temperature event in Japan could not have happened without human-induced global warming, Scientific Online Letters on the Atmosphere, doi:10.2151/sola.15A-002
from Skeptical Science http://bit.ly/2IGvA26
This is a re-post from Carbon Brief by Daisy Dunne
The record-breaking 2018 summer heatwave in Japan in which more than 1,000 people died “could not have happened without human-induced global warming”, a study finds.
And the extreme heat felt in Japan last summer could “become a usual situation” within the next few decades as temperatures continue to rise, the authors say.
The research is the latest in “attribution science”, a field that aims to quantify the “fingerprint” of climate change on extreme weather events, such as heatwaves, floods and droughts.
It follows analysis published in December which found that climate change made the UK 2018 summer heatwave up to 30 times more likely.
The study is “very interesting”, but requires “further confirmation” before its conclusions can be fully accepted, a leading attribution scientist tells Carbon Brief.
Red hot
Last year’s summer heatwave across many parts of the Northern Hemisphere made headlines worldwide. The heat broke temperature records from Belfast to Denver and drove wildfires in places such as Sweden, Greece and California.
In Japan, temperatures reached a record high of 41.1C in July. Early reports at the time suggested that dozens had died in the record-breaking weather. The Japanese government later reported that 1,032 people died during the month-long period.
The new study assesses the extent to which human-caused climate change could have boosted the odds of such a heatwave occuring. The results are published in Scientific Online Letters on the Atmosphere, a journal published by the Meteorological Society of Japan.
It also assesses the extent to which natural changes to the weather could have influenced the odds of such a heatwave.
At the time of the heatwave, Japan experienced a “two-tiered high-pressure system”. High-pressure systems move slowly over land, often causing persistent hot and dry conditions.
During the event, two high-pressure systems were stacked on top of each other in the troposphere, explains study lead author Dr Yukiko Imada, a senior researcher at the Japan Meteorological Agency. She tells Carbon Brief:
“A high-pressure system brings descending flows and raises the temperature. [Intense] sunshine also helps to raise the temperature. Last year, those two high pressure systems were stronger and expanded over Japan.”
Another world
To work out the extent to which global warming could have boosted the chances of such a heatwave, the authors used a climate model to compare the chances of the heatwave happening in today’s world to a hypothetical world without climate change.
To do this, the researchers produced two sets of simulations. The first set included many of the factors that can influence the climate, including human-driven greenhouse gases, volcanic eruptions and solar variability. The second set included all of these factors except for human-driven greenhouse gases.
The researchers then studied the simulations to see how often heatwaves on the same scale to that seen in 2018 occur in both the “real” world and the world without global warming.
They found that, in today’s world, a heatwave on the scale of that seen in 2018 has around a one-in-five chance of occuring. However, in a world without climate change, such a heatwave would have almost no chance of occuring, says Imada:
“Surprisingly, under the climate without global warming, the event probability reduced to almost zero. That is [to say], the last-year event could not have happened without global warming.”
The map below, which is taken from the study, gives a breakdown of the results at different points across Japan.
The map shows the difference in the number of extremely hot days expected in July in today’s world and a world without climate change across Japan. For example, red areas are found to experience up to eight more extremely hot days in July in today’s world than in a world without climate change.
The difference in the number of extremely hot days expected in July in today’s world and a world without climate change across Japan. Yellow indicates little to no difference in the number of hot days in today’s world and a world without climate change, while red indicates a difference of up to eight days. (The map also includes parts of eastern China, Russia and North and South Korea.) Source: Imada et al. (2019)
The map shows that global warming has caused “a pronounced increase in extremely hot days in the populated areas of Japan”, including Tokyo, the authors say in their research paper.
Warming’s fingerprint
The researchers also used statistical methods to study how the two-tiered high-pressure system could have influenced the odds of such a heatwave.
They find that the weather system at least doubled the chances of such extreme heat occuring.
The chart below, which is taken from the study, gives a picture of how both global warming and the two-tiered high-pressure system influenced the odds of such a heatwave.
The chart shows a range of probability curves (also known as PDFs). The blue curve shows the probability of such a heatwave in the “non-warming” world – a world without human-driven climate change – while the red curve shows the probability in a world with climate change.
In addition to this, the pink curve shows the probability in today’s world when the chance of a two-tiered high-pressure system is also included, while the orange curve shows the probability when the weather system is not included. The black line shows the actual data from 2018.
Probability curves (PDFs) of the chances of a heatwave on the same scale to that seen in Japan in 2018 in a world without global warming (blue), a world with global warming (red), a world with global warming and “two-tiered high-pressure systems” (pink) and a world with global warming and without two-tiered high-pressure systems. The black line shows the actual data from 2018. Source: Imada et al. (2019)
The chart shows that, in today’s world, such a heatwave has around a one-in-five (19.9%) chance of happening. This rises to around a one-in-four chance (24.6%) when the chances of a two-tiered high-pressure weather system are also factored in.
The chances of such a heatwave happening a world without global warming are so small as to be almost negligible, the chart shows.
The authors also made projections for the future. They find that if global warming is limited to 1.5C above pre-industrial levels – the aspirational goal of the Paris Agreement – the average area in Japan could experience around 3.6 extremely hot July days per year. (Japan’s average area currently experiences 2.7 hot July days per year.)
If warming reaches 2C, the number of extremely hot July days per year could rise to 4.8, the authors add.
‘Preliminary result’
The findings are the “latest in a series of studies” that show that “some temperature extremes at country level would be essentially impossible were it not for the effects of human-induced climate change”, says Prof Peter Stott, a leading attribution scientist from the Met Office Hadley Centre, who was not involved in the study. He tells Carbon Brief:
“Their conclusion that the heatwave event ‘would never have happened without anthropogenic global warming’ does depend heavily on the reliability of the model they use. In particular, it depends on the mean human-induced temperature change for Japan that they calculate from the model – which they estimate to be almost 2C.
“The reliability of the model is little discussed in the paper so it is hard to know whether the model is accurately representing temperature changes and variability in Japan. For that reason, I would say that this is a very interesting preliminary result that needs further confirmation before we could be confident that such extreme temperatures really would be impossible without climate change.”
It may be too soon to conclude that such a heatwave would not have occurred without climate change, but the study’s results do fit well with the global picture of how climate change is influencing heatwaves, adds Prof Sonia Seneviratne, a researcher of climate extremes from ETH Zurich. She tells Carbon Brief:
“Because the results are based on a single model and on a finite, but large, number of simulations, we cannot fully exclude at the moment that a single realisation with a different model could display such extreme conditions in Japan under pre-industrial climate conditions.
“But this seems extremely unlikely given the large temperature anomalies that were observed in the country – and given the very large and demonstrated effects of increasing CO2 in amplifying temperature extremes across the world. This is even less likely when considering the event in the context of all the heatwaves that occurred in the northern hemisphere during that summer.”
Imada, Y. et al. (2019) The July 2018 high temperature event in Japan could not have happened without human-induced global warming, Scientific Online Letters on the Atmosphere, doi:10.2151/sola.15A-002
from Skeptical Science http://bit.ly/2IGvA26