Why are young – and not so young – people becoming more vociferous in their protests about global warming? Why has climate change become a political and partisan issue at democratic elections? Why do ‘greenies’ try to stop the development of new coal mines and call for speedier reduction of our greenhouse gas emissions? The answer is that the effects of greenhouse gas emissions, particularly Carbon Dioxide (CO2), are becoming increasingly evident and dangerous – although relatively mild at present, compared to what they could soon become.
Much is being said about the cost of reducing greenhouse gas emissions in terms of lost jobs, lost income and harm to national and global economies but we hear relatively little about the catastrophic consequences of not reducing emissions. Prioritising short term profit and ideology ahead of emissions reduction will inevitably result in an uncontrollable, unpredictable and destructive climate resulting in socio-economic collapse.
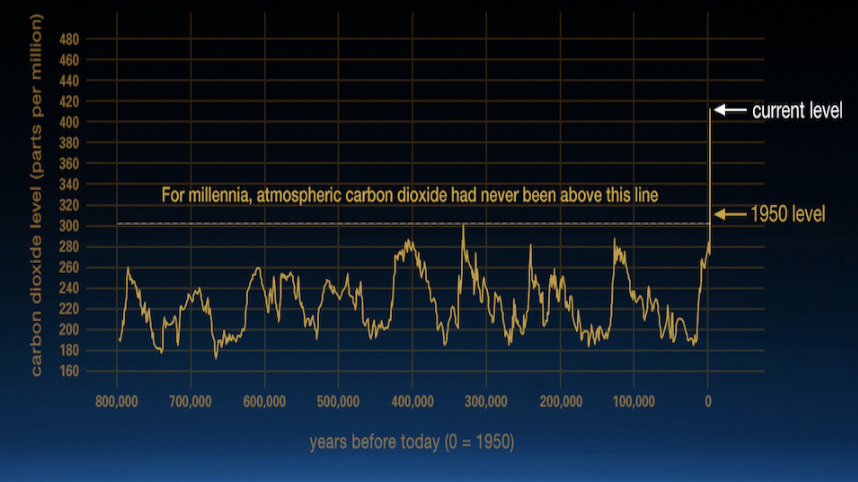
Fig. 1. Fluctuations in the level of CO2 in the atmosphere, relatively regular until burning of fossil fuels began about 200 years ago. Note the ‘spike’ on the right at year ‘0’ Source: Nasa.
Analysis of air trapped in ice cores shows that over the past 800,000 years the normal concentration of CO2 in the atmosphere varies between 170 parts per million (ppm) during cold periods (so called Ice Ages) to 260-300 ppm when the planet reaches its warmest. Concentration of CO2 in the atmosphere now stands at over 415 ppm and is continuing to rise at an accelerating rate as we burn ever increasing amounts of fossil fuels.
For well over a century it has been widely known that CO2 absorbs infra-red light reflected from the earths’ surface then re-emits it, much of it back to the surface. The higher the concentration of CO2 in the atmosphere, the warmer the surface temperature gets, a phenomenon known as global warming which has a number of effects including 1. ocean warming, 2. loss of land-based ice and permafrost, 3. climate change which becomes less predictable and 4. sea level rise. Below is an outline of these effects.
1. Ocean Warming
Most of the additional heat generated by rising levels of CO2 in the atmosphere is absorbed by the oceans. As a result, sea surface temperature is rising and already causing:
Thermal Expansion: As its temperature increases, seawater expands, contributing to sea level rise, changes in ocean circulation and higher seabed water temperature which may be damaging and pose the dangers described below:
Coastal Erosion: Rise in sea level, combined with other factors such as stronger wind events and loss of natural barriers protecting the coastline, result in increased coastal erosion endangering infrastructure, buildings and other facilities located in close proximity to the coastline.
Arctic Erosion: The Arctic ocean is warming, resulting in stronger storm activity and reduced sea ice formation, both contributing to erosion of coastlines hitherto kept stable by permafrost and sea ice reducing wave action. This causes increased exposure and thawing of methane (CH4) bearing sediments and yedoma resulting in emission of this gas and its oxidation to CO2, contributing to its rising presence in the atmosphere and further global warming.
Warmer bottom water: This is accelerating melting of ice enabling faster flow from glaciers discharging to the oceans and erosion of the marine ice sheet covering the West Antarctic archipelago – both causing sea level rise to accelerate and reducing stability of the ice sheet.
Warming seawater, particularly where shallow such as that covering the East Siberian Arctic Shelf, causes thawing of permafrost sediments containing CH4, which is being released directly to the atmosphere, contributing to accelerated global warming.
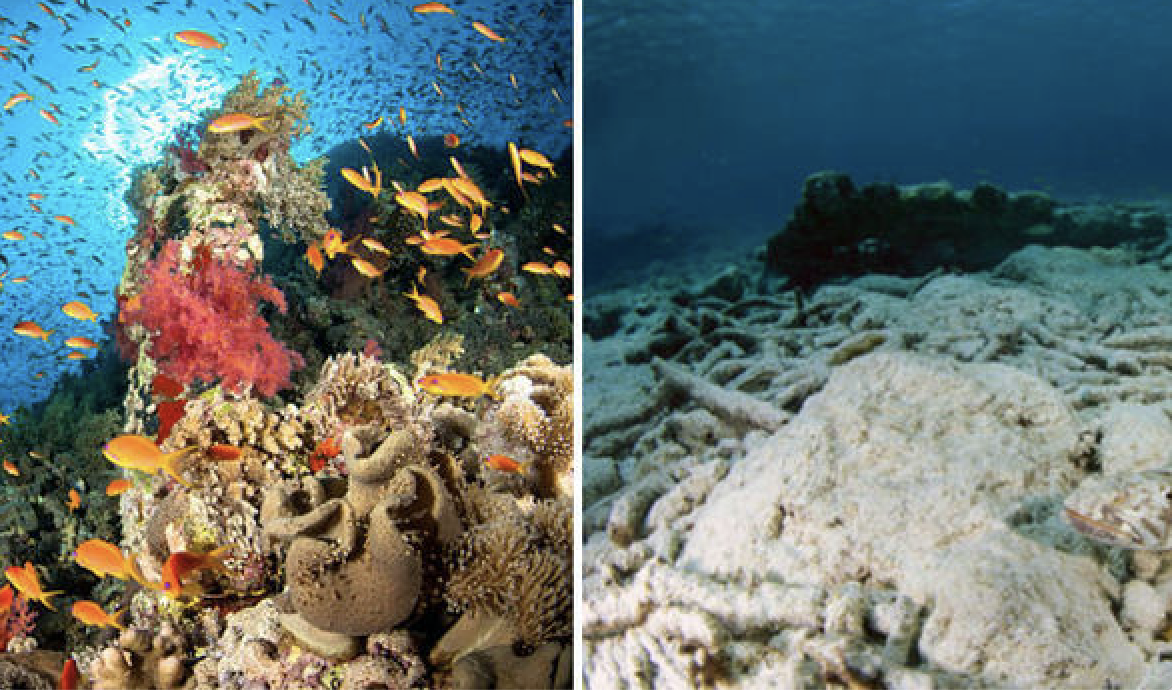
Fig 2. Before and After. When corals are stressed by temperature they eject algae from their tissues, which give them their colour and die, losing the numerous varieties of fish which depend on them. Source: Environments in Danger.
Coral Die-off: Reefs comprise a great variety of corals often growing in relatively shallow water. Coral reefs are weakened by human pollution making them susceptible to predation but are severely stressed or killed en masse by seawater temperature rising by 2C or more for 6-10 weeks or longer. Their loss exposes adjacent coastlines, often low-lying, to erosion and flooding, destroys fish habitat and reduces fish catch for human consumption.
2.Ice Loss
Mountain glaciers store water which flows into rivers on which human populations depend for potable water, irrigation, food production, transport and generating energy, often in areas of dense population. These glaciers are storing less water and melting more rapidly so that in the future sufficient water may not be available for an expanding human population and its increasing demand for food and potable water.
Permafrost: Vast areas of land in the Arctic contain partly decomposed biota, sediments containing CH4 produced from biota decomposition and yedoma. These lands are permanently frozen but global warming produces surface temperatures which result in it melting more rapidly and to greater depth. As it melts, it exposes biota which thaws, resuming decomposition and producing CH4 much of which is converted to CO2 through oxidation by methantrophic bacteria, then emitted to the atmosphere.
As permafrost melts the land subsides and becomes covered, in shallow water creating anoxic conditions in which methanotrophs are not active and this results in CH4 from decaying biota and thawing yedoma being released to the atmosphere. CH4 and CO2 emitted from permafrost land thawing accelerate global warming. These emissions are already occurring and can not be safely controlled by human intervention.
Land Subsidence: Buildings and infrastructure built on permanently frozen land, particularly in Russia and Alaska, is put at risk when warming surface temperature causes permafrost to thaw and the land to subside. At risk are transport infrastructure, electricity supply, water and sewage mains, oil and gas pipelines and buildings and bridges – even entire cities. Land subsidence is likely to cause damage to the environment – eg. spills from ruptured pipelines. It may prove so costly to repair damage caused by subsidence as to force asset abandonment.
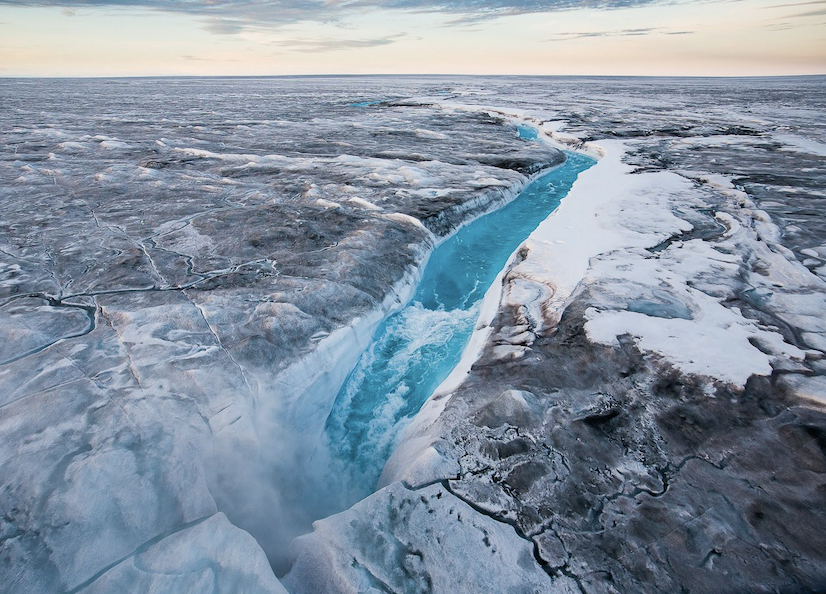
Fig. 3. River flowing on surface of Greenland Ice Sheet into a moulin reaching the ice sheet base. Note discolouration of ice due to aerosol deposits of soot originating from forest and tundra fires, reducing albedo and causing faster ice melt. Credit: Adam Scott Images.
Polar Ice Sheets: Global warming causes the surface of the Greenland Ice Sheet to melt more rapidly, resulting in rivers flowing on its surface, terminating in moulins through which they drain to bedrock. This intensely cold water lubricates the underside of the ice-sheet making it more mobile, before draining into the North Atlantic where it contributes to disruption of overturning circulation and flow of the Gulf Stream.
Ice Melt: Disruption of overturning circulation traps warmer water on the seabed causing the West Antarctic marine ice sheet to melt at its base, contributing to its instability. Warm seawater penetrates polar glaciers eroding ice blockages, enabling glaciers to discharge ice at faster rates resulting in ice sheets becoming less stable, as evidenced in Greenland and West Antarctica. This contributes to faster sea level rise which increases the risk of coastal erosion and flooding.
3. Climate Change
The temperature of the troposphere is now slightly under 1°C above the pre-industrial and is continuing to rise due to increasing emission of greenhouse gasses. This warming is characterised by less predictable, increasingly severe weather events, which include the following:
Temperatures: temperature extremes are setting new record highs and fewer days of extreme cold, though these do occur in the northern hemisphere due to distortion of the polar vortex.
Droughts: affecting farmland and habitat are becoming longer lasting – in many cases lasting over 5 years and reducing river flows.
Evaporation: Increased evaporation of water from soil and lakes occurs because the troposphere is getting warmer and able to hold more water in the form of vapour.
Wind Events such as cyclones and tornados may be less frequent but are more powerful and destructive, their strength increased by rising sea surface temperature.
Rainfall: In some areas rainfall has become less frequent but heavier and of longer duration, while hail storms have become more severe, often with larger hail stones.
On-going global warming will cause these events to become more frequent, last longer and become more severe. Alone or in combination they will continue to cause increasing damage to the environment in the following ways:
Rising temperatures are the principal cause of coral reefs dying, the loss of fish habitat and the protection they provide to low-lying coastal land from erosion by ocean wave action, making them vulnerable to flooding. On-shore temperature extremes are already setting new record highs resulting in declining food production and premature deaths.
Droughts and evaporation of surface water produce similar effects, converting some food bowls to dust bowls, increasing the rate of desertification and killing flora and fauna. Droughts in some parts of Australia have lasted over 8 years, causing rivers to run dry, preventing crop sowing, forcing destocking and overland transport of water to enable survival of town populations.
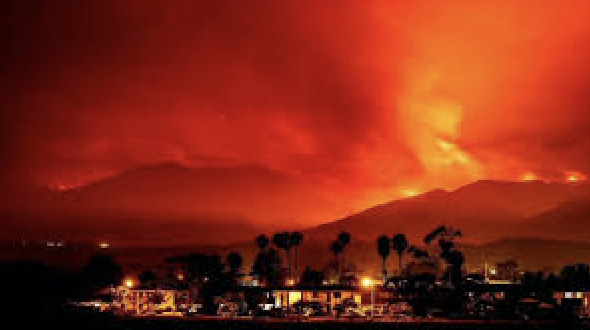
Fig. 4. Wildfires are becoming larger, more difficult to control or uncontrollable. Damage and destruction of property by wildfires is increasingly expensive with insured losses of 2018 California fires estimated to exceed $10 billion.
Combined, these events result in ferocious bushfires which are increasingly difficult to control, causing huge losses of trees, vegetation, fauna and property – including livestock – all becoming more and more costly to replace, more often forcing abandonment. They also enable pathogens and pests such as mountain pine beetles to invade and kill millions of trees and the spread of vectors carrying human diseases into areas hitherto free of them.
Wind events, often accompanied by heavy rainfall, are becoming more frequent and often result in flooding, loss of human life, damage to property, the environment and crop losses. They produce tidal surges which erode coastlines and flood low lying land.
4. Sea Level Rise
We know that thermal expansion caused by ocean warming and loss of mass from ice sheets and glaciers are the primary causes of sea level rise. Less certain is the speed with which these causes take effect.
Many climate scientists specialising in this area, notably those contributing to IPCC Assessment Reports, are of the view that these are relatively slow processes indicating sea level rise of 0.52-0.98 metres by 2100. Others, including leading specialists in this field, point to evidence showing more rapid loss of ice, producing much faster, multi-metre sea level riseover the same period because of accelerating loss of mass from both the West Antarctic and Greenland ice caps, primarily as a result of increased glacier discharge rates.
Many of the worlds’ cities are located on low coastal land which is very vulnerable to a multi-metre rise in sea level. Australia’s Gold Coast with hundreds of kilometres of canals connected to the sea, Miami in Florida, even mega cities such as Shanghai would sustain heavy damage from sea level rise. Island nations such as Kiribati and the Maldives would be flooded, forcing abandonment. A rise of at least 2 metres is now thought possible by 2100.
World-wide the value of coastal property is likely plummet by hundreds of millions of dollars since there is no protection from rising seas or the increasingly severe storms which they will produce. Several hundred million people may have to retreat from coastal areas threatened by rising sea level this century.
Conclusions
For more than fifty years, climate scientists have warned that continued emission of greenhouse gasses into the atmosphere, particularly CO2, would result in climate change and if average global temperature rises by more than 1.5°C. above pre-industrial levels, those changes would be dangerous. If average global temperature rises by more than 2°C climate changes could become catastrophic, threatening most life on the planet. If we continue to ignore these warnings, we do so at our peril. In practice we have ignored them.
There is only one way of averting the outcomes described above and that is by stopping all use of fossil fuels over the next 10-20 years, improving the ability of natural carbon sinks and new technology to absorb CO2 from the atmosphere. Transition to a decarbonised economy can be achieved within this time frame and, in the process, renewable energy required by the human population could become unlimited in its availability, rather than a constraint on innovation.
There is a price to pay for achieving this. The price is to reduce demand for fossil fuels to meet our energy needs and replace them with renewable energy. Reduction in demand for fossil fuels will result in shut-down of oil fields and refineries, closure of coal mines and stopping production and use of gas over the next 20 years. We have long known the inevitability of these outcomes and the need to ensure they are achieved in a planned, orderly way, involving retraining and re-employment of those currently engaged in them.
Too higher price to pay? Not when compared with the alternative which is to resist change and, in the interests of maximising profit, continue to move far too slowly to avert increasingly dangerous outcomes. Young people rightly protest against this and those responsible for killing flora and fauna (which includes humans), destroying their habitat and giving impetus to the 6thmass extinction now in progress.
from Skeptical Science http://bit.ly/2WJDEYZ
Why are young – and not so young – people becoming more vociferous in their protests about global warming? Why has climate change become a political and partisan issue at democratic elections? Why do ‘greenies’ try to stop the development of new coal mines and call for speedier reduction of our greenhouse gas emissions? The answer is that the effects of greenhouse gas emissions, particularly Carbon Dioxide (CO2), are becoming increasingly evident and dangerous – although relatively mild at present, compared to what they could soon become.
Much is being said about the cost of reducing greenhouse gas emissions in terms of lost jobs, lost income and harm to national and global economies but we hear relatively little about the catastrophic consequences of not reducing emissions. Prioritising short term profit and ideology ahead of emissions reduction will inevitably result in an uncontrollable, unpredictable and destructive climate resulting in socio-economic collapse.
Fig. 1. Fluctuations in the level of CO2 in the atmosphere, relatively regular until burning of fossil fuels began about 200 years ago. Note the ‘spike’ on the right at year ‘0’ Source: Nasa.
Analysis of air trapped in ice cores shows that over the past 800,000 years the normal concentration of CO2 in the atmosphere varies between 170 parts per million (ppm) during cold periods (so called Ice Ages) to 260-300 ppm when the planet reaches its warmest. Concentration of CO2 in the atmosphere now stands at over 415 ppm and is continuing to rise at an accelerating rate as we burn ever increasing amounts of fossil fuels.
For well over a century it has been widely known that CO2 absorbs infra-red light reflected from the earths’ surface then re-emits it, much of it back to the surface. The higher the concentration of CO2 in the atmosphere, the warmer the surface temperature gets, a phenomenon known as global warming which has a number of effects including 1. ocean warming, 2. loss of land-based ice and permafrost, 3. climate change which becomes less predictable and 4. sea level rise. Below is an outline of these effects.
1. Ocean Warming
Most of the additional heat generated by rising levels of CO2 in the atmosphere is absorbed by the oceans. As a result, sea surface temperature is rising and already causing:
Thermal Expansion: As its temperature increases, seawater expands, contributing to sea level rise, changes in ocean circulation and higher seabed water temperature which may be damaging and pose the dangers described below:
Coastal Erosion: Rise in sea level, combined with other factors such as stronger wind events and loss of natural barriers protecting the coastline, result in increased coastal erosion endangering infrastructure, buildings and other facilities located in close proximity to the coastline.
Arctic Erosion: The Arctic ocean is warming, resulting in stronger storm activity and reduced sea ice formation, both contributing to erosion of coastlines hitherto kept stable by permafrost and sea ice reducing wave action. This causes increased exposure and thawing of methane (CH4) bearing sediments and yedoma resulting in emission of this gas and its oxidation to CO2, contributing to its rising presence in the atmosphere and further global warming.
Warmer bottom water: This is accelerating melting of ice enabling faster flow from glaciers discharging to the oceans and erosion of the marine ice sheet covering the West Antarctic archipelago – both causing sea level rise to accelerate and reducing stability of the ice sheet.
Warming seawater, particularly where shallow such as that covering the East Siberian Arctic Shelf, causes thawing of permafrost sediments containing CH4, which is being released directly to the atmosphere, contributing to accelerated global warming.
Fig 2. Before and After. When corals are stressed by temperature they eject algae from their tissues, which give them their colour and die, losing the numerous varieties of fish which depend on them. Source: Environments in Danger.
Coral Die-off: Reefs comprise a great variety of corals often growing in relatively shallow water. Coral reefs are weakened by human pollution making them susceptible to predation but are severely stressed or killed en masse by seawater temperature rising by 2C or more for 6-10 weeks or longer. Their loss exposes adjacent coastlines, often low-lying, to erosion and flooding, destroys fish habitat and reduces fish catch for human consumption.
2.Ice Loss
Mountain glaciers store water which flows into rivers on which human populations depend for potable water, irrigation, food production, transport and generating energy, often in areas of dense population. These glaciers are storing less water and melting more rapidly so that in the future sufficient water may not be available for an expanding human population and its increasing demand for food and potable water.
Permafrost: Vast areas of land in the Arctic contain partly decomposed biota, sediments containing CH4 produced from biota decomposition and yedoma. These lands are permanently frozen but global warming produces surface temperatures which result in it melting more rapidly and to greater depth. As it melts, it exposes biota which thaws, resuming decomposition and producing CH4 much of which is converted to CO2 through oxidation by methantrophic bacteria, then emitted to the atmosphere.
As permafrost melts the land subsides and becomes covered, in shallow water creating anoxic conditions in which methanotrophs are not active and this results in CH4 from decaying biota and thawing yedoma being released to the atmosphere. CH4 and CO2 emitted from permafrost land thawing accelerate global warming. These emissions are already occurring and can not be safely controlled by human intervention.
Land Subsidence: Buildings and infrastructure built on permanently frozen land, particularly in Russia and Alaska, is put at risk when warming surface temperature causes permafrost to thaw and the land to subside. At risk are transport infrastructure, electricity supply, water and sewage mains, oil and gas pipelines and buildings and bridges – even entire cities. Land subsidence is likely to cause damage to the environment – eg. spills from ruptured pipelines. It may prove so costly to repair damage caused by subsidence as to force asset abandonment.
Fig. 3. River flowing on surface of Greenland Ice Sheet into a moulin reaching the ice sheet base. Note discolouration of ice due to aerosol deposits of soot originating from forest and tundra fires, reducing albedo and causing faster ice melt. Credit: Adam Scott Images.
Polar Ice Sheets: Global warming causes the surface of the Greenland Ice Sheet to melt more rapidly, resulting in rivers flowing on its surface, terminating in moulins through which they drain to bedrock. This intensely cold water lubricates the underside of the ice-sheet making it more mobile, before draining into the North Atlantic where it contributes to disruption of overturning circulation and flow of the Gulf Stream.
Ice Melt: Disruption of overturning circulation traps warmer water on the seabed causing the West Antarctic marine ice sheet to melt at its base, contributing to its instability. Warm seawater penetrates polar glaciers eroding ice blockages, enabling glaciers to discharge ice at faster rates resulting in ice sheets becoming less stable, as evidenced in Greenland and West Antarctica. This contributes to faster sea level rise which increases the risk of coastal erosion and flooding.
3. Climate Change
The temperature of the troposphere is now slightly under 1°C above the pre-industrial and is continuing to rise due to increasing emission of greenhouse gasses. This warming is characterised by less predictable, increasingly severe weather events, which include the following:
Temperatures: temperature extremes are setting new record highs and fewer days of extreme cold, though these do occur in the northern hemisphere due to distortion of the polar vortex.
Droughts: affecting farmland and habitat are becoming longer lasting – in many cases lasting over 5 years and reducing river flows.
Evaporation: Increased evaporation of water from soil and lakes occurs because the troposphere is getting warmer and able to hold more water in the form of vapour.
Wind Events such as cyclones and tornados may be less frequent but are more powerful and destructive, their strength increased by rising sea surface temperature.
Rainfall: In some areas rainfall has become less frequent but heavier and of longer duration, while hail storms have become more severe, often with larger hail stones.
On-going global warming will cause these events to become more frequent, last longer and become more severe. Alone or in combination they will continue to cause increasing damage to the environment in the following ways:
Rising temperatures are the principal cause of coral reefs dying, the loss of fish habitat and the protection they provide to low-lying coastal land from erosion by ocean wave action, making them vulnerable to flooding. On-shore temperature extremes are already setting new record highs resulting in declining food production and premature deaths.
Droughts and evaporation of surface water produce similar effects, converting some food bowls to dust bowls, increasing the rate of desertification and killing flora and fauna. Droughts in some parts of Australia have lasted over 8 years, causing rivers to run dry, preventing crop sowing, forcing destocking and overland transport of water to enable survival of town populations.
Fig. 4. Wildfires are becoming larger, more difficult to control or uncontrollable. Damage and destruction of property by wildfires is increasingly expensive with insured losses of 2018 California fires estimated to exceed $10 billion.
Combined, these events result in ferocious bushfires which are increasingly difficult to control, causing huge losses of trees, vegetation, fauna and property – including livestock – all becoming more and more costly to replace, more often forcing abandonment. They also enable pathogens and pests such as mountain pine beetles to invade and kill millions of trees and the spread of vectors carrying human diseases into areas hitherto free of them.
Wind events, often accompanied by heavy rainfall, are becoming more frequent and often result in flooding, loss of human life, damage to property, the environment and crop losses. They produce tidal surges which erode coastlines and flood low lying land.
4. Sea Level Rise
We know that thermal expansion caused by ocean warming and loss of mass from ice sheets and glaciers are the primary causes of sea level rise. Less certain is the speed with which these causes take effect.
Many climate scientists specialising in this area, notably those contributing to IPCC Assessment Reports, are of the view that these are relatively slow processes indicating sea level rise of 0.52-0.98 metres by 2100. Others, including leading specialists in this field, point to evidence showing more rapid loss of ice, producing much faster, multi-metre sea level riseover the same period because of accelerating loss of mass from both the West Antarctic and Greenland ice caps, primarily as a result of increased glacier discharge rates.
Many of the worlds’ cities are located on low coastal land which is very vulnerable to a multi-metre rise in sea level. Australia’s Gold Coast with hundreds of kilometres of canals connected to the sea, Miami in Florida, even mega cities such as Shanghai would sustain heavy damage from sea level rise. Island nations such as Kiribati and the Maldives would be flooded, forcing abandonment. A rise of at least 2 metres is now thought possible by 2100.
World-wide the value of coastal property is likely plummet by hundreds of millions of dollars since there is no protection from rising seas or the increasingly severe storms which they will produce. Several hundred million people may have to retreat from coastal areas threatened by rising sea level this century.
Conclusions
For more than fifty years, climate scientists have warned that continued emission of greenhouse gasses into the atmosphere, particularly CO2, would result in climate change and if average global temperature rises by more than 1.5°C. above pre-industrial levels, those changes would be dangerous. If average global temperature rises by more than 2°C climate changes could become catastrophic, threatening most life on the planet. If we continue to ignore these warnings, we do so at our peril. In practice we have ignored them.
There is only one way of averting the outcomes described above and that is by stopping all use of fossil fuels over the next 10-20 years, improving the ability of natural carbon sinks and new technology to absorb CO2 from the atmosphere. Transition to a decarbonised economy can be achieved within this time frame and, in the process, renewable energy required by the human population could become unlimited in its availability, rather than a constraint on innovation.
There is a price to pay for achieving this. The price is to reduce demand for fossil fuels to meet our energy needs and replace them with renewable energy. Reduction in demand for fossil fuels will result in shut-down of oil fields and refineries, closure of coal mines and stopping production and use of gas over the next 20 years. We have long known the inevitability of these outcomes and the need to ensure they are achieved in a planned, orderly way, involving retraining and re-employment of those currently engaged in them.
Too higher price to pay? Not when compared with the alternative which is to resist change and, in the interests of maximising profit, continue to move far too slowly to avert increasingly dangerous outcomes. Young people rightly protest against this and those responsible for killing flora and fauna (which includes humans), destroying their habitat and giving impetus to the 6thmass extinction now in progress.
from Skeptical Science http://bit.ly/2WJDEYZ