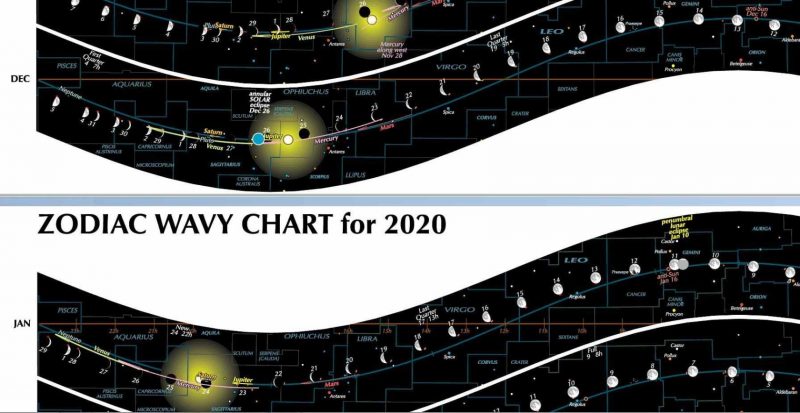

View larger.| Zodiac Wavy Charts are giant posters, 2 feet wide and 3 feet high (.6 by 1 meter). They show in graphic form the events across the sky for each month of the year. Cool holiday gift! Read more here.
Reprinted with permission from Guy Ottewell’s blog
You can see space but you can’t see time.
Time is an ice that instantly sublimes.
You can see time only by translating it into space: into graphs, in which it is one of the dimensions. You can see, from the Zodiac Wavy Charts, above, in which one of the dimensions is months and the other is the zodiac, that 2020 is less than a month away, and that the sun is dipping deepest south in its journey through the provinces of the zodiac. And will in January begin feeling its way back north.
In the December band of the chart, you can see the first quarter moon of the middle of Wednesday, December 4, and Venus speeding ahead of the sun into the evening sky and overtaking Saturn on December 11.
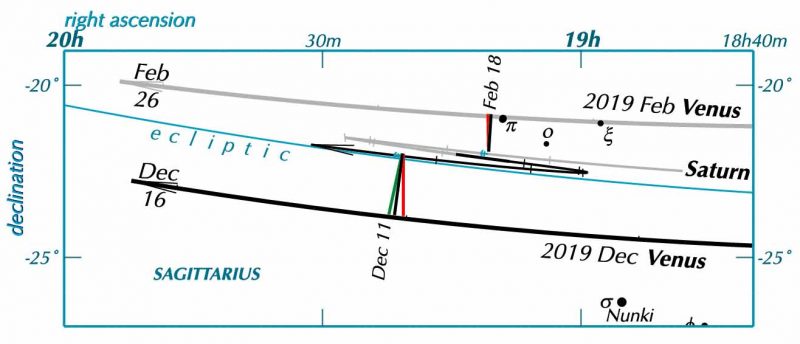
Here is a map of the part of the sky in which the Venus-Saturn encounter takes place.
EarthSky 2020 lunar calendars are available! They make great gifts. Order now. Going fast!

View larger. | Sky chart showing the part of the ecliptic where Venus and Saturn will be in December 2019, via Guy Ottewell’s blog.
Saturn’s path is shown for the whole of 2019; Venus’s, for part of February and part of December. The paths are gray when the planets are in the morning sky, and black in the evening sky, as they are now.
In a year, Saturn travels only about 1/30 of the way around the sky; Venus goes roughly all around the sky, because it stays roughly near the sun. So in 2019 Venus passed Saturn in February, and will pass Saturn again in December.
Read more and see a chart: Venus-Saturn pairing on December 10
Why are there three connecting lines at each of the dates?
The red line is perpendicular to the celestial equator (which is horizontal and off the top of this map). It connects the planets at the moment of conjunction in right ascension: that is, the moment when one is exactly north of the other. This is the kind of conjunction often given in almanacs, because it suits the view in equatorially-mounted telescopes.
The green line is perpendicular to the ecliptic. It connects the planets at the moment when one passes the other in ecliptic longitude.
The black line connects them at the moment of their appulse: when the angular distance between them is shortest.
In the present case, the three moments fall only a few hours apart. But they can be up to several days apart, if the two bodies are quite far apart, or if one of them is on a strongly curving part of its path.
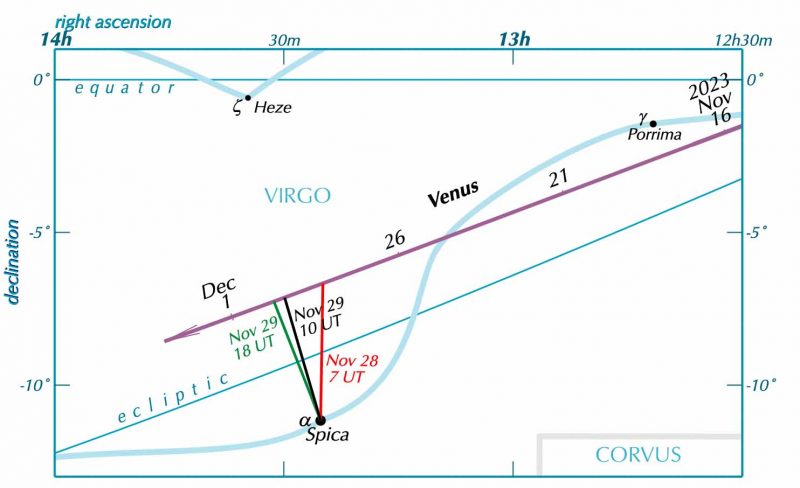
I confess that I’ve lost at least four days trying to get the programming of these geometries sorted out. I was working on it because it’s very interesting for Venus. I think I’ll show one of my diagrams, for another kind of Venus conjunction, for Venus and the star Spica in 2023.

View larger. | Venus and the bright star Spica in the constellation Virgo in 2023, via Guy Ottewell’s blog.
Bottom line: A word from astronomer Guy Ottewell – plus charts – giving you some insights on the December 10, 2019, conjunction between Venus and Saturn.
Visit Stellarium for a precise view from your location at any given time.
from EarthSky https://ift.tt/2RlaJaK


View larger.| Zodiac Wavy Charts are giant posters, 2 feet wide and 3 feet high (.6 by 1 meter). They show in graphic form the events across the sky for each month of the year. Cool holiday gift! Read more here.
Reprinted with permission from Guy Ottewell’s blog
You can see space but you can’t see time.
Time is an ice that instantly sublimes.
You can see time only by translating it into space: into graphs, in which it is one of the dimensions. You can see, from the Zodiac Wavy Charts, above, in which one of the dimensions is months and the other is the zodiac, that 2020 is less than a month away, and that the sun is dipping deepest south in its journey through the provinces of the zodiac. And will in January begin feeling its way back north.
In the December band of the chart, you can see the first quarter moon of the middle of Wednesday, December 4, and Venus speeding ahead of the sun into the evening sky and overtaking Saturn on December 11.
Here is a map of the part of the sky in which the Venus-Saturn encounter takes place.
EarthSky 2020 lunar calendars are available! They make great gifts. Order now. Going fast!

View larger. | Sky chart showing the part of the ecliptic where Venus and Saturn will be in December 2019, via Guy Ottewell’s blog.
Saturn’s path is shown for the whole of 2019; Venus’s, for part of February and part of December. The paths are gray when the planets are in the morning sky, and black in the evening sky, as they are now.
In a year, Saturn travels only about 1/30 of the way around the sky; Venus goes roughly all around the sky, because it stays roughly near the sun. So in 2019 Venus passed Saturn in February, and will pass Saturn again in December.
Read more and see a chart: Venus-Saturn pairing on December 10
Why are there three connecting lines at each of the dates?
The red line is perpendicular to the celestial equator (which is horizontal and off the top of this map). It connects the planets at the moment of conjunction in right ascension: that is, the moment when one is exactly north of the other. This is the kind of conjunction often given in almanacs, because it suits the view in equatorially-mounted telescopes.
The green line is perpendicular to the ecliptic. It connects the planets at the moment when one passes the other in ecliptic longitude.
The black line connects them at the moment of their appulse: when the angular distance between them is shortest.
In the present case, the three moments fall only a few hours apart. But they can be up to several days apart, if the two bodies are quite far apart, or if one of them is on a strongly curving part of its path.
I confess that I’ve lost at least four days trying to get the programming of these geometries sorted out. I was working on it because it’s very interesting for Venus. I think I’ll show one of my diagrams, for another kind of Venus conjunction, for Venus and the star Spica in 2023.

View larger. | Venus and the bright star Spica in the constellation Virgo in 2023, via Guy Ottewell’s blog.
Bottom line: A word from astronomer Guy Ottewell – plus charts – giving you some insights on the December 10, 2019, conjunction between Venus and Saturn.
Visit Stellarium for a precise view from your location at any given time.
from EarthSky https://ift.tt/2RlaJaK

Aucun commentaire:
Enregistrer un commentaire