
Self-portrait of the Curiosity rover on Mars. Image via NASA/JPL-Caltech/MSSS/ANU.
The mystery of Mars’ methane has been in the news again lately, starting with a study announced earlier this month saying it’s not likely caused by wind erosion of rocks. Now, another new study has refined estimates of methane gas in Mars’ atmosphere, showing how concentrations change over the course of a single Martian day.
The peer-reviewed study, led by John Moores at York University in Canada, was published in Geophysical Research Letters on August 20, 2019. According to Moores:
This new study redefines our understanding of how the concentration of methane in the atmosphere of Mars changes over time, and this helps us to solve the bigger mystery of what the source might be.
The source of Mars methane is the true mystery. Where does the methane come from? On Earth, methane gas can be associated with microbial life. The idea of living microbes on Mars has long intrigued astronomers. Various spacecraft sent to Mars have search for signs of life, but so far no sign of life has been revealed. In 2018, scientists announced that seasonal variations of Mars methane could be related to microorganisms. Or the variations in methane could be produced by geological means. It’s an interesting puzzle!
The new research involves data from the Trace Gas Orbiter (TGO) and the Curiosity rover. Curiosity, in Gale Crater, has detected bursts of methane at different times in recent years, and analysis indicates it peaks in summer and disappears in winter.
Now, the new study shows that the methane levels change over the course of a Martian day, as well. Moores noted:
This most recent work suggests that the methane concentration changes over the course of each day. We were able – for the first time – to calculate a single number for the rate of seepage of methane at Gale Crater on Mars that is equivalent to an average of 2.8 kg per Martian day.
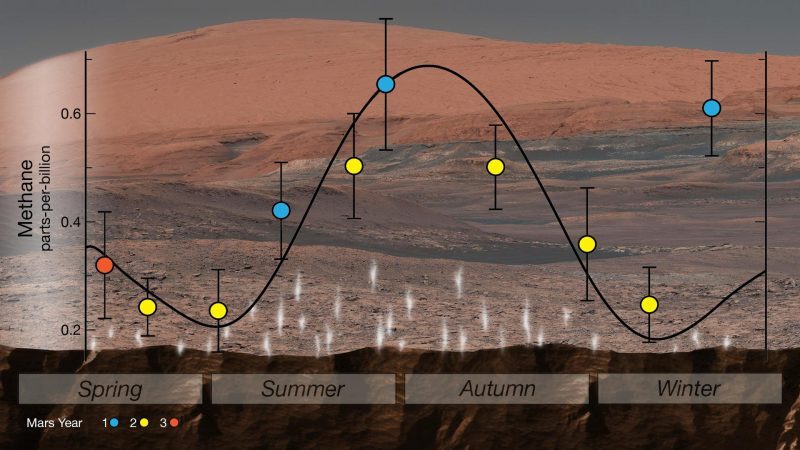
Diagram showing the seasonal cycle of methane as detected by the Curiosity rover in Gale Crater. The new study indicates that the methane varies in concentration on a daily basis as well. Image via NASA/JPL-Caltech/Mars Exploration Program.
From the paper:
The ExoMars Trace Gas Orbiter and the Curiosity Rover have recorded different amounts of methane in the atmosphere on Mars. The Trace Gas Orbiter measured very little methane (<50 parts per trillion by volume) above 5 km in the sunlit atmosphere, while Curiosity measured substantially more (410 parts per trillion by volume) near the surface at night. In this paper we describe a framework which explains both measurements by suggesting that a small amount of methane seeps out of the ground constantly. During the day, this small amount of methane is rapidly mixed and diluted by vigorous convection, leading to low overall levels within the atmosphere. During the night, convection lessens, allowing methane to build up near the surface. At dawn, convection intensifies and the near-surface methane is mixed and diluted with much more atmosphere. Using this model and methane concentrations from both approaches, we are able – for the first time – to place a single number on the rate of seepage of methane at Gale Crater which we find equivalent to 2.8 kg per Martian day. Future spacecraft measuring methane near the surface of Mars could determine how much methane seeps out of the ground in different locations, providing insight into what processes create that methane in the subsurface.
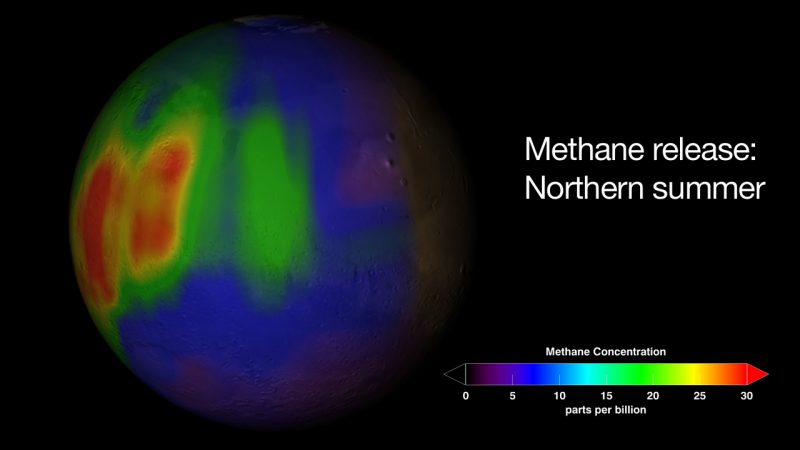
Telescopic observations of Mars have also shown methane concentrations peaking in the summer months. Image via NASA/Trent Schindler/Wikipedia.
The findings should provide more clues as to the source of the methane, which could be either biological or non-biological, at least for the methane detected around Gale Crater. The team was able to reconcile the data between TGO and Curiosity, which had presented a puzzle. While Curiosity detected the spikes in methane levels, TGO had not. As Moores explained:
We were able to resolve these differences by showing how concentrations of methane were much lower in the atmosphere during the day and significantly higher near the planet’s surface at night, as heat transfer lessens.
TGO has focused on analyzing the upper levels of the atmosphere, which may explain why it missed the methane bursts close to the ground, or perhaps because the methane spikes are seasonal.
The seasonal and daily variations could be consistent with biology – as in microbes – as the source of the methane, but there are still other plausible geological explanations as well. According to Penny King at Australia National University (ANU):
Some microbes on Earth can survive without oxygen, deep underground, and release methane as part of their waste. The methane on Mars has other possible sources, such as water-rock reactions or decomposing materials containing methane.
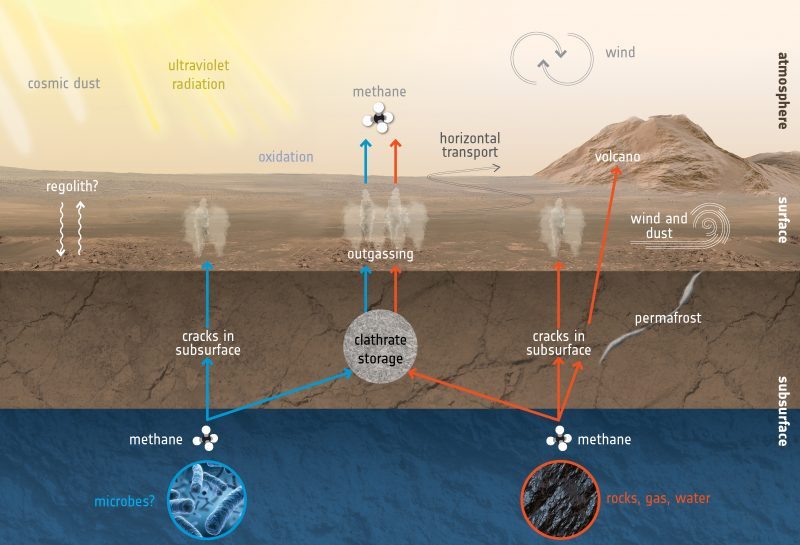
Illustration depicting what processes could create and destroy methane on Mars. The methane most likely originates from below the surface and is released into the atmosphere through subsurface cracks. Image via ESA.
While what is creating the methane is still unknown, most scientists now think it originates from underground, periodically released through cracks. This again could be consistent with either biology or geology. The geological sources could include the water-rock interactions or icy methane clathrates that contain methane and release it during warmer temperatures. If it was rocks and water, that would still be an exciting finding, indicating there is still liquid water below ground and at least some residual active geological processes. That alone could provide a nice habitat for microbes, even if they didn’t produce the methane themselves.
Whatever the explanation for the methane turns out to be, it will provide a fascinating insight into current geological or biological processes on the Red Planet.
Bottom line: A new study shows how methane in Mars’ atmosphere varies in concentration on a daily basis, not just seasonal.
from EarthSky https://ift.tt/2ZFrBt9
Self-portrait of the Curiosity rover on Mars. Image via NASA/JPL-Caltech/MSSS/ANU.
The mystery of Mars’ methane has been in the news again lately, starting with a study announced earlier this month saying it’s not likely caused by wind erosion of rocks. Now, another new study has refined estimates of methane gas in Mars’ atmosphere, showing how concentrations change over the course of a single Martian day.
The peer-reviewed study, led by John Moores at York University in Canada, was published in Geophysical Research Letters on August 20, 2019. According to Moores:
This new study redefines our understanding of how the concentration of methane in the atmosphere of Mars changes over time, and this helps us to solve the bigger mystery of what the source might be.
The source of Mars methane is the true mystery. Where does the methane come from? On Earth, methane gas can be associated with microbial life. The idea of living microbes on Mars has long intrigued astronomers. Various spacecraft sent to Mars have search for signs of life, but so far no sign of life has been revealed. In 2018, scientists announced that seasonal variations of Mars methane could be related to microorganisms. Or the variations in methane could be produced by geological means. It’s an interesting puzzle!
The new research involves data from the Trace Gas Orbiter (TGO) and the Curiosity rover. Curiosity, in Gale Crater, has detected bursts of methane at different times in recent years, and analysis indicates it peaks in summer and disappears in winter.
Now, the new study shows that the methane levels change over the course of a Martian day, as well. Moores noted:
This most recent work suggests that the methane concentration changes over the course of each day. We were able – for the first time – to calculate a single number for the rate of seepage of methane at Gale Crater on Mars that is equivalent to an average of 2.8 kg per Martian day.
Diagram showing the seasonal cycle of methane as detected by the Curiosity rover in Gale Crater. The new study indicates that the methane varies in concentration on a daily basis as well. Image via NASA/JPL-Caltech/Mars Exploration Program.
From the paper:
The ExoMars Trace Gas Orbiter and the Curiosity Rover have recorded different amounts of methane in the atmosphere on Mars. The Trace Gas Orbiter measured very little methane (<50 parts per trillion by volume) above 5 km in the sunlit atmosphere, while Curiosity measured substantially more (410 parts per trillion by volume) near the surface at night. In this paper we describe a framework which explains both measurements by suggesting that a small amount of methane seeps out of the ground constantly. During the day, this small amount of methane is rapidly mixed and diluted by vigorous convection, leading to low overall levels within the atmosphere. During the night, convection lessens, allowing methane to build up near the surface. At dawn, convection intensifies and the near-surface methane is mixed and diluted with much more atmosphere. Using this model and methane concentrations from both approaches, we are able – for the first time – to place a single number on the rate of seepage of methane at Gale Crater which we find equivalent to 2.8 kg per Martian day. Future spacecraft measuring methane near the surface of Mars could determine how much methane seeps out of the ground in different locations, providing insight into what processes create that methane in the subsurface.
Telescopic observations of Mars have also shown methane concentrations peaking in the summer months. Image via NASA/Trent Schindler/Wikipedia.
The findings should provide more clues as to the source of the methane, which could be either biological or non-biological, at least for the methane detected around Gale Crater. The team was able to reconcile the data between TGO and Curiosity, which had presented a puzzle. While Curiosity detected the spikes in methane levels, TGO had not. As Moores explained:
We were able to resolve these differences by showing how concentrations of methane were much lower in the atmosphere during the day and significantly higher near the planet’s surface at night, as heat transfer lessens.
TGO has focused on analyzing the upper levels of the atmosphere, which may explain why it missed the methane bursts close to the ground, or perhaps because the methane spikes are seasonal.
The seasonal and daily variations could be consistent with biology – as in microbes – as the source of the methane, but there are still other plausible geological explanations as well. According to Penny King at Australia National University (ANU):
Some microbes on Earth can survive without oxygen, deep underground, and release methane as part of their waste. The methane on Mars has other possible sources, such as water-rock reactions or decomposing materials containing methane.
Illustration depicting what processes could create and destroy methane on Mars. The methane most likely originates from below the surface and is released into the atmosphere through subsurface cracks. Image via ESA.
While what is creating the methane is still unknown, most scientists now think it originates from underground, periodically released through cracks. This again could be consistent with either biology or geology. The geological sources could include the water-rock interactions or icy methane clathrates that contain methane and release it during warmer temperatures. If it was rocks and water, that would still be an exciting finding, indicating there is still liquid water below ground and at least some residual active geological processes. That alone could provide a nice habitat for microbes, even if they didn’t produce the methane themselves.
Whatever the explanation for the methane turns out to be, it will provide a fascinating insight into current geological or biological processes on the Red Planet.
Bottom line: A new study shows how methane in Mars’ atmosphere varies in concentration on a daily basis, not just seasonal.
from EarthSky https://ift.tt/2ZFrBt9


 Weddell Seal West Antarctic Peninsula (photo: Dan Costa - NMFS 87-1851-03)