What's in the Green New Deal? Four key issues to understand

In the few weeks since it was introduced as a non-binding resolution before the U.S. Senate and House of Representatives, the Green New Deal (GND) Resolution has generated more discussion and coverage of climate change – positive and negative – among, by, and aimed at policymakers than we’ve seen in more than a decade.

The nonbinding initiative introduced by Rep. Alexandria Ocasio-Cortez (D-NY) and Edward Markey (D-MA) proposes embarking on a 10-year mobilization aimed at achieving zero net greenhouse gas emissions from the United States. The mobilization would entail a massive overhaul of American electricity, transportation, and building infrastructure to replace fossil fuels and improve energy efficiency, leading some to call it unrealistic, idealistic, politically impossible, and “socialistic.”

Analysis

Proponents of GND portray it as an early focus for meaningful climate policy discussion if political winds lead to changes in 2020 for the presidency and the Senate majority. They say the GND is the first proposal to grasp the scale and magnitude of the risks posed by the warming climate. And while begrudgingly accepting the insurmountable odds against full enactment before 2021 at the earliest, they see it as a worthwhile and long-overdue discussion piece.

Many commentators and policy analysts argue that the changes it calls for would be too expensive, radical, and disruptive. Others have argued that anyone who doesn’t support this sort of emergency transition away from fossil fuels is in denial about the magnitude of the climate problem. Many are confused about the Resolution’s vague contents, in part because Ocasio-Cortez’s office also released an inaccurate fact sheet that subsequently had to be retracted. That document provided early and low-hanging targets for those disposed to wanting to dampen GND enthusiasm.

A nonbinding ‘sense of the Senate’ resolution

Critically, GND must be recognized as a non-binding “sense of the Senate/House” resolution. It is not intended as proposed legislation, and certainly not as a specific climate policy bill. Think of it as being more of a framework on which to build actual climate legislation. In effect, a “yes” vote in either the Senate or the House would signify acceptance of climate change as a sufficiently urgent threat to merit full consideration of an expansive 10-year mobilization to transition away from polluting fossil fuels. In addition, the resolution isn’t intended to be exclusionary: at least five House co-sponsors are also co-sponsoring a revenue-neutral carbon tax bill (the Energy Innovation and Carbon Dividend Act).

Whether and exactly when the GND resolution will come to a full vote remains unclear, but Senate Majority Leader Mitch McConnell (R-KY) has said he will bring it to a vote in the Senate. It would likely pose an uncomfortable vote for those potentially vulnerable Democrats up for re-election in 2020 in “red” or coal-dependent states.

For Americans and their elected representatives, the decision whether to support this fundamentally transformative and sweeping resolution – provisions of which go well beyond those directly applying to climate change to include economic and social equity issues – hinges on four key factors. For politicians, the political considerations may weigh most heavily, but let’s deal with those last.

Science and physical considerations

The first consideration is the easiest from a scientific perspective: How much more global warming can occur before its net physical impacts become unacceptably negative?

The science community’s answer is that we’ve already passed that point; that it’s time to act now. Regions around the world are already experiencing more and more severe extreme weather events like heat waves, droughts, wildfires, and floods.

A paper recently published in Nature Communications found that Atlantic hurricanes are undergoing more rapid intensification as a result of global warming. Sea-level rise poses a threat to coastal communities and island nations. The one-two punch of warming and acidifying oceans is killing coral reefs, which are home to 25 percent of marine life. The recent IPCC Special Report found that “Coral reefs would decline by 70-90 percent with global warming of 2.7°F (1.5°C), and more than 99 percent would be lost with 3.6° F (2°C).” Species are dying out at a rate similar to past mass extinction events, with a new study finding that 40 percent of insect species are threatened with extinction. (For a breakdown of climate impacts in each region of the country, the Fourth National Climate Assessment is a wonderful resource.)

In short, if physical impacts were the only consideration, we would want to halt (and even reverse) climate change as quickly as possible. Of course, that’s not the case, which brings us to the second category.

Economic considerations

In a capitalist society, economic considerations are of course important to Americans. The projects involved in the GND mobilization would cost trillions of dollars, but curbing climate change could also prevent trillions of dollars in damages globally.

The GND includes a proposed jobs guarantee, envisioning that huge employment opportunities would arise to bring about the needed infrastructure overhauls. The transition away from fossil fuels would also yield further economic benefits, in terms of costs avoided, by reducing other pollutants, leading to cleaner air and water and healthier Americans. A 2017 study headed by David Coady at the International Monetary Fund estimated that fossil fuel air pollution costs the United States $206 billion per year and that when adding all subsidies and costs, the country is spending $700 billion annually on fossil fuels – more than $2,000 per person every year.

GND opponents counter that the economic costs of a vast 10-year mobilization would exceed the resulting economic benefits, but Stanford University researcher Jonathan Koomey suggests that we can’t predict just how fast of a transition to a clean energy economy would be optimal. Given the difficulties predicting technological breakthroughs and given that pathways with very different energy mixes can end up with similar costs, it’s impossible to say if the U.S. would be wealthier – from a strictly financial perspective – in a world that’s 2 or 3 or 4 degrees hotter.

People, and perhaps in particular politicians, tend to focus most on these economic considerations (and often just on costs while ignoring resulting benefits) to the exclusion of the others. But it’s very difficult to quantify and involve numerous components – capital costs, avoided climate damages, increased employment, improved public health, etc.

In addition, some factors simply cannot be quantified in dollars. As Tufts economist Frank Ackerman has noted, “There are numerous problems with CBA [cost-benefit analyses], such as the need to (literally) make up monetary prices for priceless values of human life, health and the natural environment. In practice, CBA often trivializes the value of life and nature.”

Ethical and moral considerations

Consider a family that loses its home in a climate-amplified wildfire or hurricane. Quantifying the costs of replacing the home and belongings is do-able, but how to account for the psychological trauma of the event and for psychological damages, let alone for lives lost?

Moreover, rebuilding the home will create investments and jobs, which would dampen a disaster’s impact on the national economy. But as a society, we would consider these traumatizing losses quite harmful and well worth preventing for ethical reasons. For example, one study found that nearly half of low-income parents impacted by Hurricane Katrina experienced post-traumatic stress disorder.

Researchers have found that those traditionally underserved and having the fewest resources are the least able to adapt to climate change impacts. A team led by James Samson reported in a 2011 paper that internationally, those populations contributing the least to climate change tend to be the most vulnerable to its impacts. The higher temperatures resulting from global warming do the most harm in regions that are already hot, like developing countries in Africa and Central America that also have the fewest resources to adapt. While the United States is the country responsible for the most historical carbon pollution of any country on Earth, it’s geographically and economically insulated from the projected worst impacts of climate change that these poorer, less culpable countries will face.

This reality makes it more difficult for some to justify an expensive green mobilization based solely on accounting for just this country’s direct national economic interests, particularly when focusing on short time horizons. However, ignoring the harm done by our carbon pollution to the most vulnerable people – both within and beyond our borders – raises daunting ethical and moral questions.

Moreover, as Ralph Waldo Emerson put it, “To leave the world a bit better … that is to have succeeded.” That we are leaving behind a less hospitable world for our children and grandchildren might be considered our generation’s worst moral failure of all.

Political considerations

Finally, given that climate policies must be implemented by policymakers, the question of what’s politically feasible is critical, and for some perhaps dispositive.

As of mid-February, the GND Resolution had been co-sponsored by 68 members of the House and 12 in the Senate, but all were Democrats. Those co-sponsors include many of the hopeful and high-profile 2020 Democratic presidential candidates, though there are some exceptions and some party leaders still wavering.

On the other side of the political aisle, such a large government-run mobilization is generally incompatible with traditional Republican Party orthodoxy, let alone with the President’s views as the titular head of the party. Unless the Democratic Party in 2020 retains its current House majority and gains control of the presidency and of a clear majority in the Senate, passing legislation will require bipartisanship. That’s particularly true in the Senate, where most legislation requires 60 votes to overcome a filibuster, and a two-thirds vote to override a presidential veto.

The current Republican-controlled Senate (in session until January 2021) certainly won’t consider actual legislation involving a vast government climate mobilization, although smaller individual infrastructure components might be considered. There may be growing support for a bipartisan carbon tax bill – one potential component of a GND – but that and any other significant climate legislation also will likely depend on the winners of the White House and of House and Senate majorities in 2021.

Click here to read the rest


from Skeptical Science https://ift.tt/2BX1d50

Prices are not Enough

This is a re-post from TripleCrisis by Frank Ackerman.  Fourth in a series on climate policy; find Part 1 here, Part 2 here, and Part 3 here.

We need a price on carbon emissions. This opinion, virtually unanimous among economists, is also shared by a growing number of advocates and policymakers. But unanimity disappears in the debate over how to price carbon: there is continuing controversy about the merits of taxes vs. cap-and-trade systems for pricing emissions, and about the role for complementary, non-price policies.

At the risk of spoiling the suspense, this blog post reaches two main conclusions: First, under either a carbon tax or a cap-and-trade system, the price level matters more than the mechanism used to reach that price. Second, under either approach, a reasonably high price is necessary but not sufficient for climate policy; other measures are needed to complement price incentives.

Why taxes and cap-and-trade systems are similar

A carbon tax raises the cost of fossil fuels directly, by taxing their carbon emissions from combustion. This is most easily done upstream, i.e. taxing the oil or gas well, coal mine, or fuel importer, who presumably passes the tax on to end users. There are only hundreds of upstream fuel producers and importers to keep track of, compared to millions of end users.

A cap-and-trade system accomplishes the same thing indirectly, by setting a cap on total allowable emissions, and issuing that many annual allowances. Companies that want to sell or use fossil fuels are required to hold allowances equal to their emissions. If the cap is low enough to make allowances a scarce resource, then the market will establish a price on allowances – in effect, a price on greenhouse gas emissions. Again, it is easier to apply allowance requirements, and thus induce carbon trading, at the upstream level rather than on millions of end users.

If the price of emissions is, for example, $50 per ton of carbon dioxide, then any firm that can reduce emissions for less than $50 a ton will do so – under either a tax or cap-and-trade system. Cutting emissions reduces tax payments, under a carbon tax; it reduces the need to buy allowances under a cap-and-trade system. The price, not the mechanism, is what matters for this incentive effect.

review of the economics literature on carbon taxes vs. cap-and-trade systems found a number of other points of similarity. Either system can be configured to achieve a desired distribution of the burden on households and industries, e.g. via free allocation of some allowances, or partial exemption from taxes. Money raised from either taxes or allowance auctions could be wholly or partially refunded to households.  Either approach can be manipulated to reduce effects on international competitiveness.

And problems raised with offsets – along the lines of credits given too casually for tree-planting – are not unique to cap and trade. A carbon tax could emerge from Congress riddled with obscure loopholes, which could be as damaging to the integrity of carbon pricing as any of the poorly written offset provisions of existing cap-and-trade systems. More positively speaking, either approach to carbon pricing can be carried out either with or without offsets and tax exemptions.

Why taxes and cap-and-trade systems are different

Compared to the numerous similarities between the two approaches, the list of differences is a shorter one. A carbon tax is easier and cheaper to administer. In theory, a carbon tax provides certainty about the price of emissions, while a cap-and-trade system provides certainty about the quantity of emissions (in practice, these certainties can be undone by too-frequent tinkering with tax rates or emissions caps).

Cap-and-trade systems have been more widely used in practice. The European Union’s Emissions Trading System (EU ETS) is the world’s largest carbon market. Others include the linked carbon market of California and several Canadian provinces, and the Regional Greenhouse Gas Initiative (RGGI) among states in the Northeast.

Numerous critics have pointed to potential flaws in cap-and-trade, such as overly generous, poorly monitored offsets. Many recent cap-and-trade systems, introduced in a conservative era, began with caps so high and prices so low that they have little effect (leaving them open to the criticism that the administrative costs are not justified by the skimpy results). The price must be high enough, and the cap must be low enough, to alter the behavior of major emitters.

The same applies, of course, to a carbon tax. Starting with a trivial level of carbon tax, in order to calm opponents of the measure, runs the risk of “proving” that a carbon price has no effect. The correct starting price under either system is the highest price that is politically acceptable; there is no hope of “getting the prices right” due to the uncertain and potentially disastrous scope of climate damages.

Perhaps the most salient difference between taxes and cap-and-trade is political rather than economic: in an era when people like to chant “no new taxes”, the prospects for any initiative seem worse if it involves a new tax. This could explain why there is so much more experience to date with cap-and-trade systems.

Beyond price incentives

Some carbon emitters, for instance in electricity generation, have multiple choices among alternative technologies. In such cases, price incentives alone are powerful, and producers can respond incrementally, retiring and replacing individual plants when appropriate. Other sectors face barriers that an individual firm cannot usually overcome on its own. Electric vehicles are not practical without an extensive recharging and repair infrastructure, which is just beginning to exist in a few parts of the country. In this case, no reasonable level of carbon price can, by itself, bring an adequate nationwide electric vehicle infrastructure into existence. Policies that build and promote electric vehicle infrastructure are valuable complements to a carbon price: they create a combined incentive to move away from gasoline.

Yet another reason for combining non-price climate policies with a carbon price is that purely price-based decision-making can be exhausting. People could calculate for themselves the fuel saved by buying a more fuel-efficient car and subtract that from the sticker price of the vehicle, but it is not an easy calculation. Federal and state fuel economy standards make the process simpler, by setting a floor underneath vehicle fuel efficiency.

When buying a major appliance, it is possible in theory to read the energy efficiency sticker on the carton, calculate your average annual use of the appliance, convert it to dollars saved per year, and see if that savings justifies purchase of a more efficient appliance. But who does all that arithmetic? Even I don’t want to do that calculation, and I have a PhD in economics and enjoy playing with numbers. My guess is that virtually no one does the calculation consistently and correctly. On the other hand, federal and state appliance efficiency standards have often set minimum levels of required efficiency, which increase over time. It’s much more fun to buy something off the shelf that meets those standards, instead of settling in for an extended data-crunching session any time you need a new fridge, air conditioner, washing machine…

In short, the carbon price is what matters, not the mechanism used to adopt that price. And whatever the price, non-price climate policies are needed as well – both to build things that no one company can do on its own, and to make energy-efficient choices accessible to all, without heroic feats of calculation.

Frank Ackerman is principal economist at Synapse Energy Economics in Cambridge, Mass., and one of the founders of Dollars & Sense, which publishes Triple Crisis. 


from Skeptical Science https://ift.tt/2Ucutfd

These ice-covered Chilean volcanoes could erupt soon

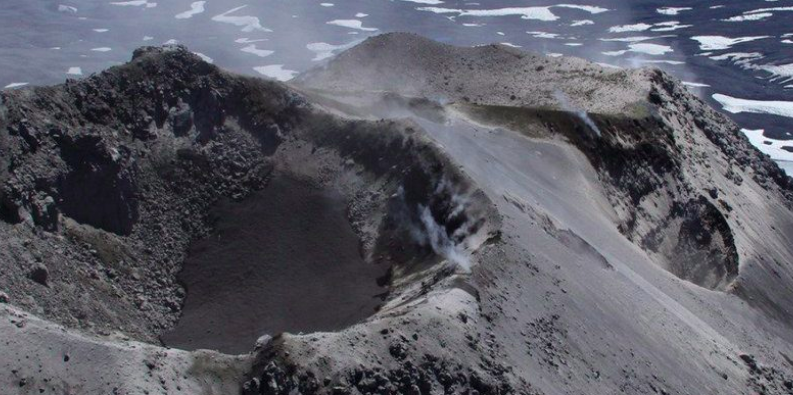
Aerial view of crater with water in it on an ash-covered mountain top.

Image via GlacierHub.

Help EarthSky keep going! Please donate what you can to our once-yearly crowd-funding campaign.

This article is republished with permission from GlacierHub. This post was written by Arley Titzler.

Stretching over 4,350 miles (7,000 km) across seven countries, the Andes are the world’s longest mountain range. They make up the southeastern portion of the Ring of Fire and are well-known for their abundant volcanoes.

The Chilean Andes are home to 90 active volcanoes, all monitored by the Chilean National Geology and Mining Service (Sernageomin). The agency categorizes volcanic activity using four distinct alert levels: green (normal level of activity), yellow (increased level of activity), orange (probable development of an eruption in the short-term), and red (eruption is ongoing or imminent). Increased volcanic activity is associated with frequent earthquakes; plumes of gas, rocks, or ash; and lava flows.

Two areas monitored by Sernageomin are currently showing signs of increased activity: the Nevados de Chillán and Planchón-Peteroa volcanic complexes. The agency issued orange and yellow alert levels for them, respectively.

Wavy lines of high mountain contours with 2 star-shaped white spots.

A satellite image of the Nevados de Chillán volcano complex, showing the glacier-covered volcano peaks. Image via Sernageomin.

Nevados de Chillán Volcanoes: Orange Alert

The Nevados de Chillán volcano complex is comprised of several glacier-covered volcanic peaks. When these volcanoes erupt, the glacial ice sitting atop them melts and mixes with lava, which can result in dangerous lahars, or mudflows. Several small earthquakes and the formation of new gas vents led Sernageomin to issue a yellow alert on December 31, 2015. (To view a detailed map of the Nevados de Chillán complex, click here.)

On April 5, 2018, Sernageomin upgraded the Nevados de Chillán’s yellow alert to an orange alert, following thousands of tremors and a thick, white column of smoke rising from the area. This signaled the likelihood of an eruption in the near future.

Sernageomin’s most recent volcanic activity report for Nevados de Chillán, issued on February 11, 2019, cited persistent seismic activity, which is directly related to increased frequency of explosions, along with the growth and/or destruction of the lava dome that lies in the crater. The expected eruption is most likely to have moderate to low explosive power, but sporadic observations over the last year have shown higher than average energy levels.

On February 15, 2019, the Volcanic Ash Advisory Center in Buenos Aires documented a volcanic-ash plume reaching 12,139 feet (3,700 meters) high at Nevados de Chillán, an example of the above mentioned “higher than average energy levels.”

Bottom line: Recent increased volcanic activity in the Nevados de Chillán prompted Chilean authorities to issue an orange alert in anticipation of an eruption.


from EarthSky https://ift.tt/2Nz7Ij5

Ceres had meltwater reservoirs for millions of years

False-color view of Ceres.

False-color view of Ceres from the Dawn spacecraft showing differences in surface materials. The bright spots are salt deposits left over from when salty water (cryomagma) reached the surface and evaporated. New research shows that subsurface reservoirs of salty meltwater existed on Ceres for millions of years. Image via NASA/JPL-CalTech/UCLA/MPS/DLR/IDA.

What astronomers now characterize as dwarf planets might seem to be little more than large asteroids. But, as planetary scientists have been discovering, dwarf planets can share characteristics with full-sized planets; they are indeed actual worlds. That’s certainly true of distant Pluto, with its blue skies, high mountains, and red snows, not to mention its system of moons. Another example is the dwarf planet Ceres, which resides in the main asteroid belt between Mars and Jupiter. Despite being a lot smaller than the primary rocky planets like Earth or even Mercury, and a lot farther from the sun, we now know Ceres has its own unique and active geological history, too.

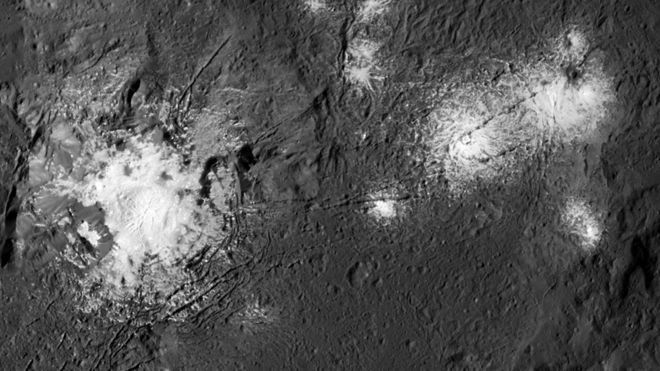
One of the most intriguing discoveries about Ceres has been evidence for ancient cryovolcanoes – an icy type of volcano that releases water, ammonia or methane instead of hot molten rock. Now, a new research study – a joint project between The University of Texas at Austin and NASA’s Jet Propulsion Laboratory (JPL) – suggests that shallow meltwater reservoirs of salty meltwater were able to stay liquid for millions of years, thanks to an insulating crust. The findings are related to the numerous bright spots seen on Ceres, in particular the largest ones in Occator Crater, which are sodium carbonate salt deposits thought to be the remnants of cryomagma – salty meltwater – that vaporized after reaching Ceres’ virtually airless surface.

Bright spots in Occator Crater.

High-resolution view of the brightest spots on Ceres, in Occator Crater. Image via NASA/JPL-CalTech/UCLA/MPS/DLR/IDA.

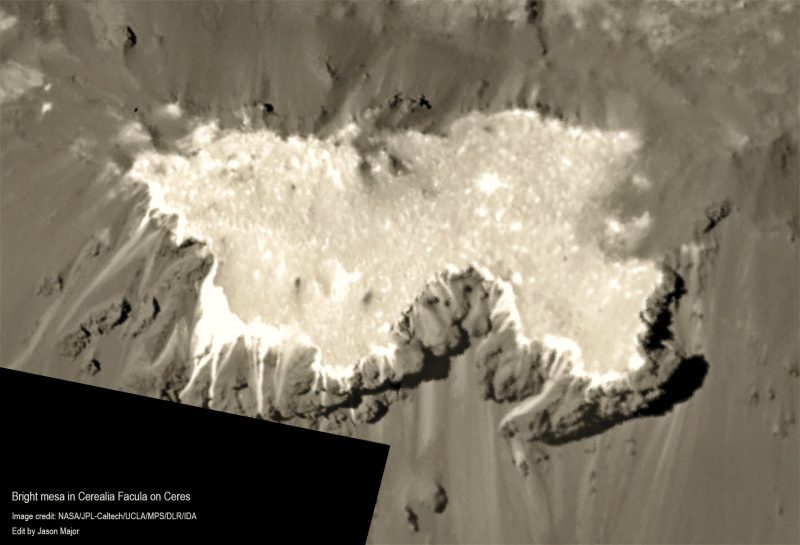
Closer view of bright spot in Occator Crater.

An even closer view of one of the bright spots in Occator Crater, on the southwest part of Cerealia Facula. The spots are now thought to be salt deposits on Ceres’ surface. They reached the surface through cracks. Image via NASA/JPL-Caltech/UCLA/MPS/DLR/IDA/Jason Major.

The new peer-reviewed research was published online on February 8, 2019 in the journal Geophysical Research Letters. From the summary:

We are testing the hypothesis that the bright spots in the center of Occator crater on Ceres are salts extruded from a large brine reservoir in the crust that melted during the asteroid impact that formed Occator Crater. The age difference between the crater and the salt deposits is approximately 16 million years and it is not clear if the brine can remain molten for such a long time. Our simulations show that an isolated impact-induced cryomagma chamber will cool in less than 12 million years. However, our simulations show that the crustal brine reservoir might communicate with a deeper brine reservoir in Ceres’ mantle. Such recharge could extend the longevity of the impact-induced cryomagma chamber beneath Occator Crater.

Cryovolcanism could help mix chemicals that produce the more complex molecules needed for life, such as on Jupiter’s moon Europa. Scientists are interested in studying how similar processes work on Ceres and whether they could could also create the molecules needed for life to begin. According to lead author Marc Hesse, an associate professor at the University of Texas at Austin Jackson School of Geosciences:

Cryovolcanism looks to be a really important system as we look for life. So we’re trying to understand these ice shells and how they behave.

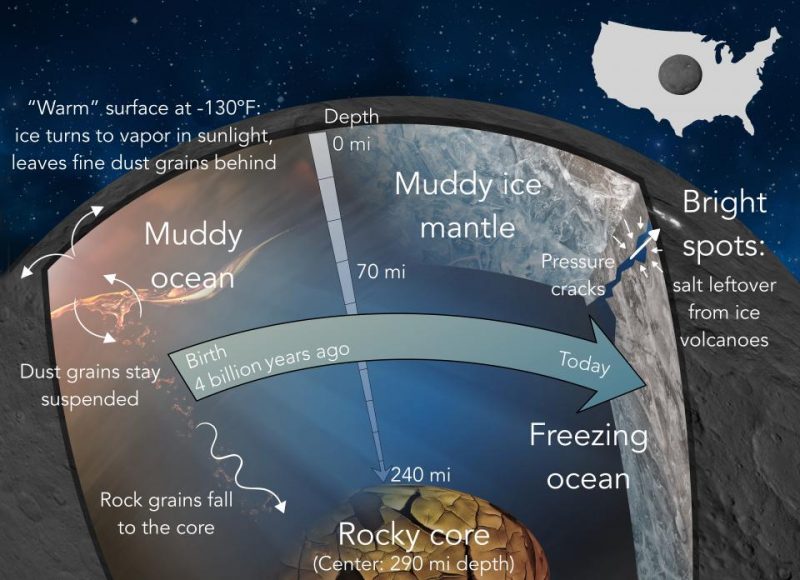
History of the interior of Ceres.

Illustration of the history of the interior of Ceres. Scientists now think that salty meltwater reservoirs (cryomagma) in the crust lasted for millions of years. Image via Neveu/Desch/Arizona State University.

This doesn’t necessarily mean that life itself ever started on Ceres, but the initial chemical interactions needed certainly could have, at least. A subsurface supply of salty water below the surface would have been an ideal environment for that to occur.

The new study focused on the bright salt deposits in Occator Crater. While the crater is about 20 million years old, the deposits are as young as 4 million years old. The cryomagma is thought to have been produced by the impact that created Occator, and was originally estimated to have only been able to remain liquid for about 400,000 years after the impact. But if the deposits are only about 4 million years old, how did the meltwater reservoirs remain liquid so long? To answer that question, Hesse and Julie Castillo-Rogez, a planetary scientist at JPL, looked closer at Ceres’ crustal chemistry and physics. As Castillo-Rogez explained:

It’s difficult to maintain liquid so close to the surface. But our new model includes materials inside the crust that tend to act as insulators consistent with the results from the Dawn observations.

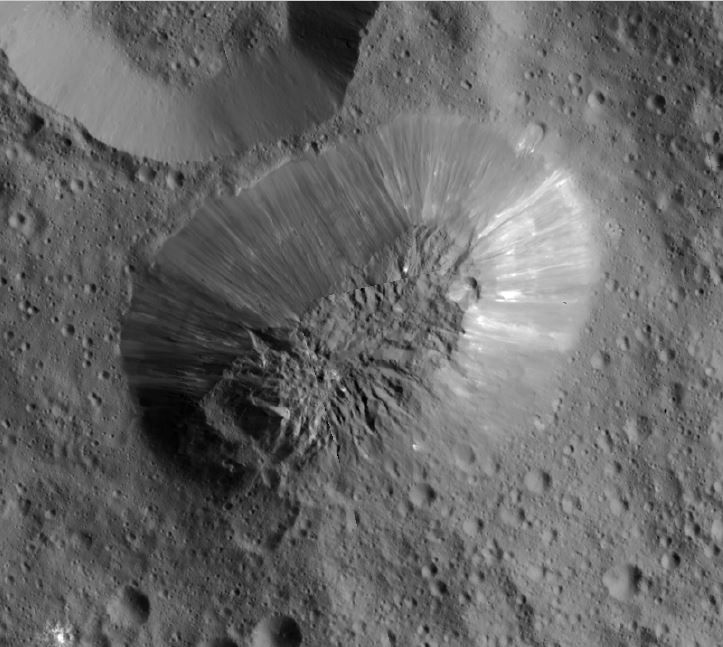
Cryovolcano Ahuna Mons on Ceres.

The large cryovolcano Ahuna Mons (“Lonely Mountain”) on Ceres, which sits in isolation on the surface with no other volcanoes nearby. Image via NASA/JPL-Caltech/UCLA/MPS/DLR/IDA.

According to their calculations, the melt reservoir of cryomagma could have lasted for 10 million years. As Hess added:

Now that we’re accounting for all these negative feedbacks on cooling – the fact that you release latent heat, the fact that as you warm up the crust it becomes less conductive – you can begin to argue that if the ages are just off by a few million years you might get it.

The bright spots, including those in Occator, tend to be located in the or near the center of impact craters, which suggests that the impacts created the reservoirs of cryomagma, which then came to the surface through cracks. The salty water evaporated, leaving the salt deposits behind.

The new findings will help scientists better understand how Ceres evolved, according to Jennifer Scully, a planetary geologist at JPL:

They used more up-to-date data to create their model. This will help in the future to see if all of the material involved in the observed deposits can be explained by the impact, or does this require a connection to a deeper source of material. It’s a great step in the right direction of answering that question.

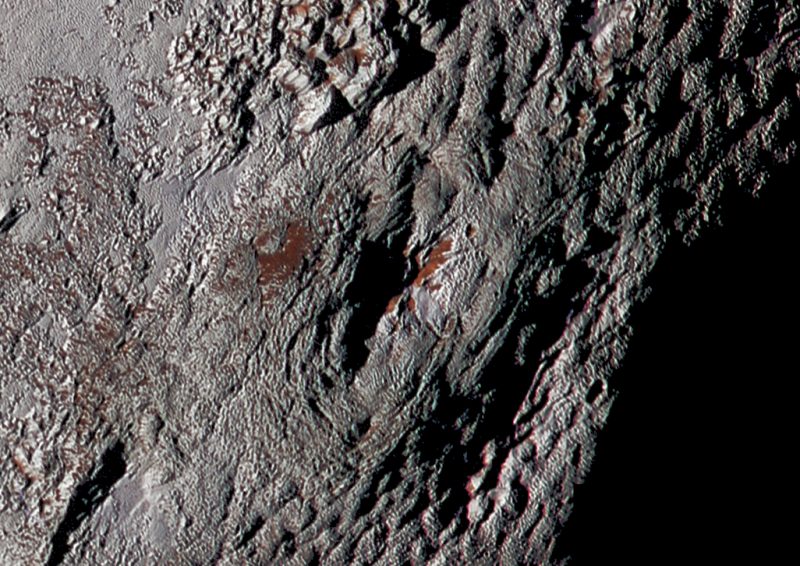
Cryovolcano on Pluto.

An ancient cryovolcano called Wright Mons on Pluto, as seen by the New Horizons spacecraft in 2015. Image via NASA/JHUAPL/SwRI.

Cryovolcanism is rather common in the outer solar system – it is known to exist, and suspected to exist, on many icy worlds including Ceres, Titan, Pluto, Europa, Enceladus, Triton and others. This icy form of volcanism mimics the “hot” volcanism of planets and moons like Earth, Venus and Io, and shows that even small, cold bodies in the solar system can be surprisingly geologically active – Ceres itself is only 592 miles (952 km) in diameter.

Bottom line: The dwarf planet Ceres had subsurface meltwater reservoirs of salty water (cryomagma) for millions of years, the new research suggests. Whether any kind of primitive life could have ever evolved in unknown, but the environment could at least have allowed the chemistry to begin that would lead to the creation of the kinds of organic molecules that are the building blocks of life.

Source: Thermal Evolution of the Impact?Induced Cryomagma Chamber Beneath Occator Crater on Ceres

Via Texas Geosciences


from EarthSky https://ift.tt/2T6A5Li

Science Surgery: ‘Why doesn’t the immune system attack cancer cells?’

Immune cells

Our Science Surgery series answers your cancer science questions.

Millie asked us on Instagram: “Why doesn’t the immune system attack cancer cells?”

“Our immune system does attack cancer cells,” says Professor Tim Elliott, a Cancer Research UK-funded immunologist from the University of Southampton.

“It’s recognising and destroying little cancers as they develop all the time. If we didn’t have an immune system, then we would be developing cancer a lot more often.”

This is because the process of cell division isn’t a perfect. The rate at which some cells grow and divide means errors can happen and cells become damaged.

In most cases, our immune system acts as quality control, making sure these cellular mistakes are nipped in the bud before they become too sinister. A group of immune cells, called killer T cells, are the ones mostly responsible for patrolling our bodies and destroying damaged cells or small tumours before they cause us harm.

So, if our immune system is so good, why do we still develop cancers that need treatment?

Immune cells eliminate tiny tumours

In the very early stages of cancer our immune cells do a good job of killing individual cancer cells as they arise. This is known as the ‘eliminating phase’, where immune cells are in control of the tumour and calmly carry out their work.

“However, if the rate of tumour growth begins to match the activity of our immune system then we enter a stage of equilibrium,” says Elliott.

Here, the immune cells are doing a good enough job at staying on top of cancer cells as they grow and divide, even though their workload is increasing.

“Some tumours can actually get fairly big but still be kept in check by our immune cells,” says Elliott. “This behaviour can sometimes last for several years.”

But as time goes on, cancer cells can develop genetic changes that help them escape the immune system. This is what has been called the ‘escape phase’.

“Unfortunately, once cancer cells really start to change and grow, they come up with ingenious ways of bypassing our immune cells and escaping their detection.”

It’s at this point that immune cells can’t keep up with the evolving tumour. Some cancer cells in the tumour become too clever and immune cells can’t adapt fast enough to keep them at bay.

Escaping the immune system

Immune cells recognise danger through a group of molecules found on the surface of all cells in the body. This helps them inspect potential problems closely and decide whether to attack.

But when a cancer reaches the ‘escape phase’ it can change. The molecules that would otherwise reveal the cancer to the immune system are lost, and killer T cells move past, unaware of the danger the cancer cell could cause.

“That’s a sure-fire way of escaping detection,” says Elliott, adding that it’s one of many escape methods cancer cells use.

“Cancer cells also develop ways to inactivate immune cells by producing molecules that make them stop working.” They also change their local environment, so it becomes a hostile place for immune cells to work.

“Once the tumours have changed their environment, any circulating killer T cells that arrive in this space are rendered inactive,” says Elliott.

Upskilling immune cells

Research has shown that changes to immune cells don’t need to be permanent. The theory is that if there’s a way to reverse these tricks, or stop immune cells falling for them, their cancer-fighting ability could be restored.

This has formed the basis of a growing range of cancer treatments called immunotherapies. And for some cancers, these drugs offer the chance of a cure that would’ve been impossible a decade ago.

They can work by releasing the brakes on immune cells so they can get cancer cells back in line. And a group of these drugs, called checkpoint inhibitors, are now being routinely used to treat a range of cancers, including some melanomas, lung and kidney cancers.

But these drugs don’t work for everyone. And scientists still need to understand more about how cancer cells get the better of immune cells. Pinpointing how cancer cells move from the ‘eliminating phase’ towards ‘escape’ could uncover new ways to stop this from happening.

So we should be reassured by the immune system’s ability to keep damaged, rogue cells at bay.

And when this ability dwindles, research is leading to immunotherapies that can reenergise our immune cells and get cancer back under control.

Gabi


from Cancer Research UK – Science blog https://ift.tt/2EiQAtF

Late February and early March guide to the bright planets

Sky chart of moon and morning planets

In late February and early March 2019, watch the moon go by Jupiter, Saturn and Venus. Read more.

Click the name of a planet to learn more about its visibility in March 2019: Venus, Jupiter, Saturn, Mars and Mercury

Post your planet photos at EarthSky Community Photos

Help EarthSky keep going! Please donate what you can to our once-yearly crowd-funding campaign.

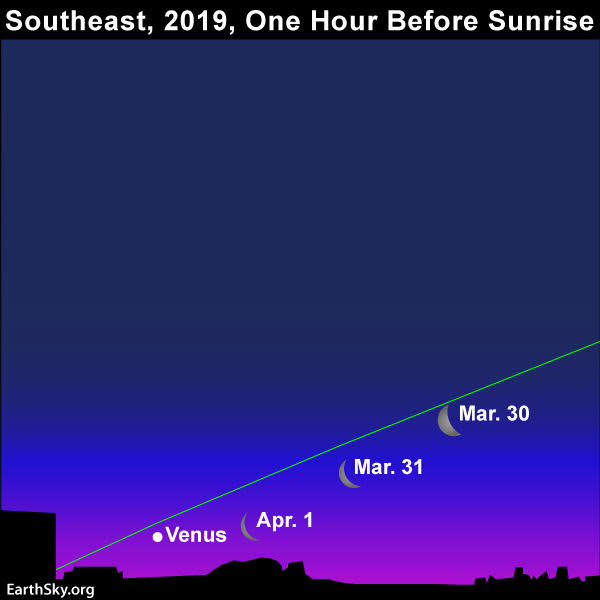
Sky chart of the waning crescent moon and Venus

If you miss the moon near Venus in late February/early March, try again one month later, in late March/early April. Read more.

Venus is the brightest planet, beaming mightily in the east in the predawn/dawn sky all month long. Watch for the waning crescent moon to join up with Venus in the morning sky for a few days, centered on or near March 2 – and then again on April 1.

Venus reached a milestone in the morning sky on January 6, 2019, as this blazing world showcased its greatest elongation from the sun. In other words, on that date, Venus was a maximum angular distance of 46 degrees west from the sun on our sky’s dome. Ever since, Venus has been slowly but surely sinking sunward.

Day by day, Venus spends a little less time in the predawn sky before sunrise with each passing morning, but it’ll still be dazzlingly bright and visible at dawn for months to come. At mid-northern latitudes, Venus will rise before astronomical twilight (dawn’s first light) until mid-March 2019; and at temperate latitudes in the Southern Hemisphere, Venus will rise before astronomical twilight until the end of May 2019.

Click here to find out when astronomical twilight comes to your sky, remembering to check the astronomical twilight box.

At mid-northern latitudes, Venus rises about two hours before sunrise in early March. By the month’s end, that’ll taper to about 1 1/2 hours.

At temperate latitudes in the Southern Hemisphere, Venus rises about 3 hours before sunup in early March. By the month’s end that’ll taper to about 2 1/2 hours.

At the month’s end and in early April, let the waning crescent moon serve as your guide to the planet Venus. See the sky chart for the morning spectacular above.

Sky chart of moon and morning planets

Let the moon be your guide to the king planet Jupiter on March 26 and 27. Read more.

Jupiter is the second-brightest planet after Venus. The king planet reigns at the top of the morning lineup of three bright planets. Jupiter sits at the peak, Saturn in between, and Venus at the bottom. This procession of morning planets finds Jupiter rising first, in the wee hours after midnight, followed by Saturn a few hours later, and then Venus before daybreak. (See the chart below for a larger panorama of sky.)

Click here for a recommended sky almanac telling you when Jupiter, Saturn and Venus rise into your sky.

If you’re up during the predawn hours, you might notice a bright ruddy star in the vicinity of Jupiter on the sky’s dome. That’s Antares, the brightest star in the constellation Scorpius the Scorpion. Although Jupiter shines in the vicinity of Antares all year long, Jupiter can be seen to wander relative to this “fixed” star of the zodiac. Jupiter travels eastward, away from Antares, until April 10, 2019. Then, for a period of four months (April 10 to August 11, 2019), Jupiter actually moves in retrograde (or westward), closing the gap between itself and the star Antares. Midway through this retrograde, Jupiter will reach opposition on June 10, 2019, to shine at its brilliant best for the year.

Watch for the waning crescent moon to swing by Jupiter on March 26 and 27.

From mid-northern latitudes, Jupiter rises about 2 hours after midnight. By the month’s end, Jupiter will rise around the midnight hour. Keep in mind that by midnight, we mean midway between sunset and sunrise.

From temperate latitudes in the Southern Hemisphere, Jupiter comes up around midnight at the beginning of the month. By the month’s end, Jupiter rises around two hours before the midnight hour.

In the March predawn/dawn sky, look for Saturn in between Jupiter and Venus. This chart covers much more area than our typical charts do. The stretch from SE (southeast) to SW (southwest) circles one-fourth the way around the horizon.

Saturn swung over to the morning sky, at least nominally, on January 2, 2019. Saturn is now a fixture of the morning sky, coming up well before dawn’s first light. Throughout the month, you can view Saturn in between the king planet Jupiter and the queen planet Venus as the morning darkness ebbs toward dawn.

Day by day throughout March, Saturn and Jupiter climb upward, away from the sunrise. Venus, on the other hand, sinks sunward by the day. Saturn, although as bright as a 1st-magnitude star, pales in contrast to Venus and Jupiter. Venus and Jupiter rank as the third-brightest and fourth-brightest celestial objects, respectively, after the sun and moon.

From mid-northern latitudes, Saturn rises about 2 1/2 hours before the sun in early March. That’ll increase to about 3 1/2 hours before sunup by the month’s end.

From temperate latitudes in the Southern Hemisphere, Saturn rises about two hours after midnight in early March, and by the month’s end, comes up around the midnight hour. As a reminder, midnight in our usage means midway between sunset and sunrise.

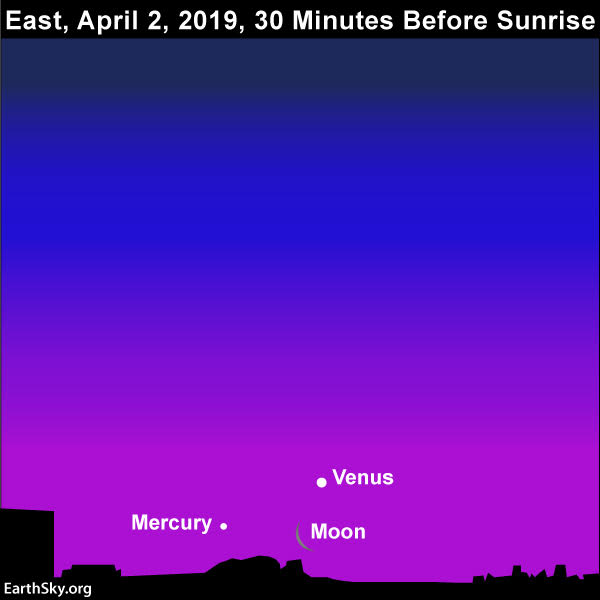
Sky chart of the moon, Venus and Mercury

Give it a try if you’d like, but spotting the moon and Mercury will be difficult on April 2, 2019 – especially at northerly latitudes. Read more.

Mercury, the innermost planet of the solar system, may be viewed in the evening sky in early March from northerly latitudes. After that, Mercury quickly descends into the glare of sunset and then transitions over into the morning sky at mid-month. Southerly latitudes will be able to spot Mercury in the morning sky by the month’s end.

Looking ahead, Mercury will adorn the morning sky all through April 2019. For the Southern Hemisphere, the month of April will present the best morning apparition of Mercury for the year. At northerly latitudes, Mercury’s morning appearance in April will be obscured by morning twilight.

At mid-northern latitudes, Mercury rises less than one hour before the sun in the waning days of March. In contrast, at temperate latitudes in the Southern Hemisphere, Mercury comes up better than 1 1/2 hours before the sun in late March.

At southerly latitudes, Mercury will rise before dawn’s first light all through April 2019.

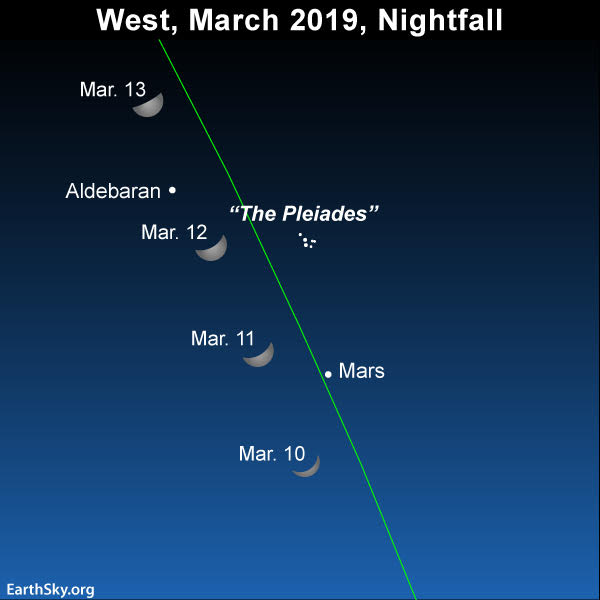
Sky chart of moon and Mars

Watch for the moon to be in the vicinity of the red planet Mars on March 10 and 11. Read more.

Mars is the only bright planet to appear in the March evening sky all month long. Although Mars dims somewhat over the month, it remains modestly-bright, exhibiting 1st-magnitude brightness all month long (though just barely). Moreover, Mars stays out till late evening at mid-northern latitudes, and until early to mid-evening in the Southern Hemisphere.

Click here for recommended sky almanacs providing you with the setting times for Mars.

Watch for the moon to shine in the vicinity of Mars on the evenings of March 10 and 11.

Look for Mars to pair up with the Pleiades cluster in late March, as displayed on the sky chart below. You may – or may not – need binoculars to see the Pleiades. Watch Mars now because the red planet will fade into a 2nd-magnitude object by early April 2019.

Sky chart of mars and the Pleiades cluster

In late March 2019, use the planet Mars to locate the Pleiades star cluster and the red giant star Aldebaran. Read more.

What do we mean by bright planet? By bright planet, we mean any solar system planet that is easily visible without an optical aid and that has been watched by our ancestors since time immemorial. In their outward order from the sun, the five bright planets are Mercury, Venus, Mars, Jupiter and Saturn. These planets actually do appear bright in our sky. They are typically as bright as – or brighter than – the brightest stars. Plus, these relatively nearby worlds tend to shine with a steadier light than the distant, twinkling stars. You can spot them, and come to know them as faithful friends, if you try.

silhouette of man against the sunset sky with bright planet and crescent moon

Skywatcher, by Predrag Agatonovic.

Bottom line: In March, Mars shines in the evening sky all month long, whereas Venus, Jupiter and Saturn adorn the morning sky. Mercury appears in the evening sky in early March and then the morning sky in late March. Click here for recommended almanacs; they can help you know when the planets rise and set in your sky.

Don’t miss anything. Subscribe to EarthSky News by email

Visit EarthSky’s Best Places to Stargaze, and recommend a place we can all enjoy. Zoom out for worldwide map.

Help EarthSky keep going! Donate now.


from EarthSky https://ift.tt/1YD00CF
Sky chart of moon and morning planets

In late February and early March 2019, watch the moon go by Jupiter, Saturn and Venus. Read more.

Click the name of a planet to learn more about its visibility in March 2019: Venus, Jupiter, Saturn, Mars and Mercury

Post your planet photos at EarthSky Community Photos

Help EarthSky keep going! Please donate what you can to our once-yearly crowd-funding campaign.

Sky chart of the waning crescent moon and Venus

If you miss the moon near Venus in late February/early March, try again one month later, in late March/early April. Read more.

Venus is the brightest planet, beaming mightily in the east in the predawn/dawn sky all month long. Watch for the waning crescent moon to join up with Venus in the morning sky for a few days, centered on or near March 2 – and then again on April 1.

Venus reached a milestone in the morning sky on January 6, 2019, as this blazing world showcased its greatest elongation from the sun. In other words, on that date, Venus was a maximum angular distance of 46 degrees west from the sun on our sky’s dome. Ever since, Venus has been slowly but surely sinking sunward.

Day by day, Venus spends a little less time in the predawn sky before sunrise with each passing morning, but it’ll still be dazzlingly bright and visible at dawn for months to come. At mid-northern latitudes, Venus will rise before astronomical twilight (dawn’s first light) until mid-March 2019; and at temperate latitudes in the Southern Hemisphere, Venus will rise before astronomical twilight until the end of May 2019.

Click here to find out when astronomical twilight comes to your sky, remembering to check the astronomical twilight box.

At mid-northern latitudes, Venus rises about two hours before sunrise in early March. By the month’s end, that’ll taper to about 1 1/2 hours.

At temperate latitudes in the Southern Hemisphere, Venus rises about 3 hours before sunup in early March. By the month’s end that’ll taper to about 2 1/2 hours.

At the month’s end and in early April, let the waning crescent moon serve as your guide to the planet Venus. See the sky chart for the morning spectacular above.

Sky chart of moon and morning planets

Let the moon be your guide to the king planet Jupiter on March 26 and 27. Read more.

Jupiter is the second-brightest planet after Venus. The king planet reigns at the top of the morning lineup of three bright planets. Jupiter sits at the peak, Saturn in between, and Venus at the bottom. This procession of morning planets finds Jupiter rising first, in the wee hours after midnight, followed by Saturn a few hours later, and then Venus before daybreak. (See the chart below for a larger panorama of sky.)

Click here for a recommended sky almanac telling you when Jupiter, Saturn and Venus rise into your sky.

If you’re up during the predawn hours, you might notice a bright ruddy star in the vicinity of Jupiter on the sky’s dome. That’s Antares, the brightest star in the constellation Scorpius the Scorpion. Although Jupiter shines in the vicinity of Antares all year long, Jupiter can be seen to wander relative to this “fixed” star of the zodiac. Jupiter travels eastward, away from Antares, until April 10, 2019. Then, for a period of four months (April 10 to August 11, 2019), Jupiter actually moves in retrograde (or westward), closing the gap between itself and the star Antares. Midway through this retrograde, Jupiter will reach opposition on June 10, 2019, to shine at its brilliant best for the year.

Watch for the waning crescent moon to swing by Jupiter on March 26 and 27.

From mid-northern latitudes, Jupiter rises about 2 hours after midnight. By the month’s end, Jupiter will rise around the midnight hour. Keep in mind that by midnight, we mean midway between sunset and sunrise.

From temperate latitudes in the Southern Hemisphere, Jupiter comes up around midnight at the beginning of the month. By the month’s end, Jupiter rises around two hours before the midnight hour.

In the March predawn/dawn sky, look for Saturn in between Jupiter and Venus. This chart covers much more area than our typical charts do. The stretch from SE (southeast) to SW (southwest) circles one-fourth the way around the horizon.

Saturn swung over to the morning sky, at least nominally, on January 2, 2019. Saturn is now a fixture of the morning sky, coming up well before dawn’s first light. Throughout the month, you can view Saturn in between the king planet Jupiter and the queen planet Venus as the morning darkness ebbs toward dawn.

Day by day throughout March, Saturn and Jupiter climb upward, away from the sunrise. Venus, on the other hand, sinks sunward by the day. Saturn, although as bright as a 1st-magnitude star, pales in contrast to Venus and Jupiter. Venus and Jupiter rank as the third-brightest and fourth-brightest celestial objects, respectively, after the sun and moon.

From mid-northern latitudes, Saturn rises about 2 1/2 hours before the sun in early March. That’ll increase to about 3 1/2 hours before sunup by the month’s end.

From temperate latitudes in the Southern Hemisphere, Saturn rises about two hours after midnight in early March, and by the month’s end, comes up around the midnight hour. As a reminder, midnight in our usage means midway between sunset and sunrise.

Sky chart of the moon, Venus and Mercury

Give it a try if you’d like, but spotting the moon and Mercury will be difficult on April 2, 2019 – especially at northerly latitudes. Read more.

Mercury, the innermost planet of the solar system, may be viewed in the evening sky in early March from northerly latitudes. After that, Mercury quickly descends into the glare of sunset and then transitions over into the morning sky at mid-month. Southerly latitudes will be able to spot Mercury in the morning sky by the month’s end.

Looking ahead, Mercury will adorn the morning sky all through April 2019. For the Southern Hemisphere, the month of April will present the best morning apparition of Mercury for the year. At northerly latitudes, Mercury’s morning appearance in April will be obscured by morning twilight.

At mid-northern latitudes, Mercury rises less than one hour before the sun in the waning days of March. In contrast, at temperate latitudes in the Southern Hemisphere, Mercury comes up better than 1 1/2 hours before the sun in late March.

At southerly latitudes, Mercury will rise before dawn’s first light all through April 2019.

Sky chart of moon and Mars

Watch for the moon to be in the vicinity of the red planet Mars on March 10 and 11. Read more.

Mars is the only bright planet to appear in the March evening sky all month long. Although Mars dims somewhat over the month, it remains modestly-bright, exhibiting 1st-magnitude brightness all month long (though just barely). Moreover, Mars stays out till late evening at mid-northern latitudes, and until early to mid-evening in the Southern Hemisphere.

Click here for recommended sky almanacs providing you with the setting times for Mars.

Watch for the moon to shine in the vicinity of Mars on the evenings of March 10 and 11.

Look for Mars to pair up with the Pleiades cluster in late March, as displayed on the sky chart below. You may – or may not – need binoculars to see the Pleiades. Watch Mars now because the red planet will fade into a 2nd-magnitude object by early April 2019.

Sky chart of mars and the Pleiades cluster

In late March 2019, use the planet Mars to locate the Pleiades star cluster and the red giant star Aldebaran. Read more.

What do we mean by bright planet? By bright planet, we mean any solar system planet that is easily visible without an optical aid and that has been watched by our ancestors since time immemorial. In their outward order from the sun, the five bright planets are Mercury, Venus, Mars, Jupiter and Saturn. These planets actually do appear bright in our sky. They are typically as bright as – or brighter than – the brightest stars. Plus, these relatively nearby worlds tend to shine with a steadier light than the distant, twinkling stars. You can spot them, and come to know them as faithful friends, if you try.

silhouette of man against the sunset sky with bright planet and crescent moon

Skywatcher, by Predrag Agatonovic.

Bottom line: In March, Mars shines in the evening sky all month long, whereas Venus, Jupiter and Saturn adorn the morning sky. Mercury appears in the evening sky in early March and then the morning sky in late March. Click here for recommended almanacs; they can help you know when the planets rise and set in your sky.

Don’t miss anything. Subscribe to EarthSky News by email

Visit EarthSky’s Best Places to Stargaze, and recommend a place we can all enjoy. Zoom out for worldwide map.

Help EarthSky keep going! Donate now.


from EarthSky https://ift.tt/1YD00CF

When is the next leap year?

Curve of Earth's horizon viewed from orbit with bright sun coming up over the edge.

Earthly calendars have to work hard to stay in sync with the natural rhythms of Earth’s orbit around the sun.

Help EarthSky keep going! Please donate what you can to our annual crowd-funding campaign.

The last leap year was 2016, and the next one is 2020! Leap days are extra days added to the calendar to help synchronize it with Earth’s orbit around the sun and the actual passing of the seasons. Why do we need them? Blame Earth’s orbit around the sun, which takes approximately 365.25 days. It’s that .25 that creates the need for a leap year every four years.

During non-leap years, aka common years – like 2019 – the calendar doesn’t take into account the extra quarter of a day actually required by Earth to complete a single orbit around the sun. In essence, the calendar year, which is a human artifact, is faster than the actual solar year, or year as defined by our planet’s motion through space.

Over time and without correction, the calendar year would drift away from the solar year and the drift would add up quickly. For example, without correction the calendar year would be off by about one day after four years. It’d be off by about 25 days after 100 years. You can see that, if even more time were to pass without the leap year as a calendar correction, eventually February would be a summer month in the Northern Hemisphere.

During leap years, a leap day is added to the calendar to slow down and synchronize the calendar year with the seasons. Leap days were first added to the Julian Calendar in 46 B.C. by Julius Caesar at the advice of Sosigenes, an Alexandrian astronomer.

Engraving of man in Renaissance clothing with books and an orbital globe on a table.

Celebrating the leap year? Take a moment to thank Christopher Clavius (1538-1612). This German mathematician and astronomer figured out how and where to place them in the Gregorian calendar. Image via Wikimedia Commons.

In 1582, Pope Gregory XIII revised the Julian calendar by creating the Gregorian calendar with the assistance of Christopher Clavius, a German mathematician and astronomer. The Gregorian calendar further stated that leap days should not be added in years ending in “00” unless that year is also divisible by 400. This additional correction was added to stabilize the calendar over a period of thousands of years and was necessary because solar years are actually slightly less than 365.25 days. In fact, a solar year occurs over a period of 365.2422 days.

Hence, according to the rules set forth in the Gregorian calendar leap years have occurred or will occur during the following years:

1600 1604 1608 1612 1616 1620 1624 1628 1632 1636 1640 1644 1648 1652 1656 1660 1664 1668 1672 1676 1680 1684 1688 1692 1696 1704 1708 1712 1716 1720 1724 1728 1732 1736 1740 1744 1748 1752 1756 1760 1764 1768 1772 1776 1780 1784 1788 1792 1796 1804 1808 1812 1816 1820 1824 1828 1832 1836 1840 1844 1848 1852 1856 1860 1864 1868 1872 1876 1880 1884 1888 1892 1896 1904 1908 1912 1916 1920 1924 1928 1932 1936 1940 1944 1948 1952 1956 1960 1964 1968 1972 1976 1980 1984 1988 1992 1996 2000 2004 2008 2012 2016 2020 2024 2028 2032 2036 2040 2044 2048 2052 2056 2060 2064 2068 2072 2076 2080 2084 2088 2092 2096 2104 2108 2112 2116 2120 2124 2128 2132 2136 2140 2144 2148 2152.

Notice that 2000 was a leap year because it is divisible by 400, but that 1900 was not a leap year.

Since 1582, the Gregorian calendar has been gradually adopted as a “civil” international standard for many countries around the world.

Bottom line: 2019 isn’t a leap year, because it isn’t evenly divisible by 4. The next leap day will be added to the calendar on February 29, 2020.

A fixed-date calendar and no time zones, researchers say

Should the leap second be abolished?


from EarthSky https://ift.tt/2GMQUo5

Want cleaner roadside air? Plant hedges

Double tailpipe under back of car with clouds of exhaust coming out.

Emissions from an automobile. Image Credit: Wikipedia.

Help EarthSky keep going! Please donate what you can to our once-yearly crowd-funding campaign.

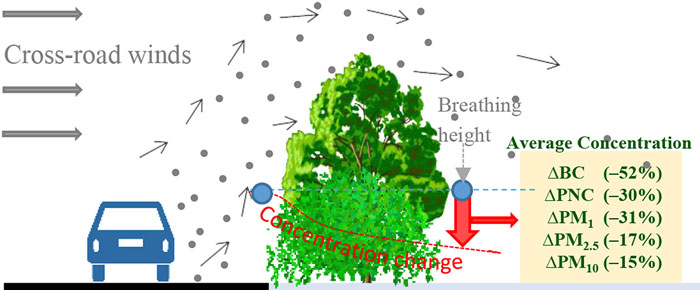
Urban air quality can really stink! In cities, scores of vehicles emit enormous quantities of pollutants into the air, and these pollutants can pose serious threats to your health. While a long-term fix for this problem will require emission reductions from tailpipes, quick exposure reductions could be achieved by planting hedges – lines of closely spaced shrubs and sometimes trees – along busy roadways, according to new research by scientists from the Global Centre for Clean Air Research (GCARE) in the United Kingdom. Their new research, to be published in the journal Atmospheric Environment on March 15, 2019, suggests that some atmospheric pollutants can be reduced by more than half at the breathing height level by the use of green infrastructure such as hedges.

Horizontal leafy hedge in front of a house.

A high hedge in the UK. Image via Sunday Times.

The scientists took measurements of air pollutant levels in and around different types of green infrastructure such as hedges, trees, and hedges plus trees planted along roadways in Guildford, U.K. In doing so, they found that hedges could reduce the levels of black carbon by up to 63 percent. Lesser but still significant reductions in particulate matter and heavy metals were also detected in the areas with hedges.

In some areas with hedges and trees, the pollutant reduction effects were also substantial, but few pollutant reduction effects were detected in areas with just trees. The scientists suspect that this occurred because the tree canopies were too high to have had much of a blocking effect on the air pollutants.

Besides the variations caused by the different types of vegetation, the pollutant reduction effects depended on the direction of the wind.

Drawing: Car on left, dots going over a cross-section of a hedge.

Graphical illustration of hedges and trees removing air pollutants – black carbon (BC), particulate matter (PM) and particulate number concentration (PNC) – from vehicles. Image via Atmospheric Environment.

Prashant Kumar, Director of GCARE at the University of Surrey, commented on the findings in a statement. He said:

Many millions of people across the world live in urban areas where the pollution levels are also the highest. The best way to tackle pollution is to control it at the source. However, reducing exposure to traffic emissions in near-road environments has a big part to play in improving health and well-being for city-dwellers. […] This study, which extends our previous work, provides new evidence to show the important role strategically placed roadside hedges can play in reducing pollution exposure for pedestrians, cyclists and people who live close to roads. Urban planners should consider planting denser hedges, and a combination of trees with hedges, in open-road environments. Many local authorities have, with the best of intentions, put a great emphasis on urban greening in recent years. However, the dominant focus has been on roadside trees, while there are many miles of fences in urban areas that could be readily complemented with hedges, with appreciable air pollution exposure dividend. Urban vegetation is important given the broad role it can play in urban ecosystems – and this could be about much more than just trees on wide urban roads.

Bottom line: Scientists have discovered that hedges can be used to help improve air quality alongside urban roads.

Source: Field investigations for evaluating green infrastructure effects on air quality in open-road conditions


from EarthSky https://ift.tt/2tGcl1N

Green dragon aurora over Iceland

Green dragon-like aurora over Iceland.

Jingyi Zhang and Wang Zheng captured this stunning dragon shape in an aurora over Iceland in early February, 2019. The image ran as the Astronomy Picture of the Day for February 18, 2019, which wrote: “This iconic display was so enthralling that the photographer’s mother ran out to see it and was captured in the foreground.”

Auroras can be stunningly beautiful as they ripple across the sky in all of their colorful glory. These natural light shows are one of the most majestic phenomena that can be seen at high latitudes on Earth (and they happen elsewhere as well, such as on Jupiter and Saturn). Auroras tend to occur on Earth at times when the sun is active, when solar magnetic fields twist around and “burst,” send out charged particles deep into space. The particles that hit Earth’s atmosphere can create auroral displays. The display shown in the photo above – captured by Jingyi Zhang and Wang Zheng over Iceland in February, 2019 – happened to have the shape of a dragon.

The dragon shape, of course, was only temporary in the aurora’s shifting curtains of light. It’s an example of pareidolia, that is, seeing recognizable objects or patterns in otherwise random or unrelated objects. Click here to see more examples of pareidolia.

What a sight! Thank you, Jingyi Zhang and Wang Zheng.

By the way, the same auroral display resulted in another photo that resembled a rising phoenix.

Aurora with the shape of a huge rising bird

Phoenix shape in an aurora, captured the same night as the dragon shape, above, by Jingyi Zhang and Wang Zheng.

Help EarthSky keep going! Please donate what you can to our annual crowd-funding campaign.

Bottom line: Seeing dragons and phoenixes in auroras are an example of pareidolia, stemming from our human tendency to seek patterns in random information.

Via APOD


from EarthSky https://ift.tt/2VhuFd8

Touchdown marks on asteroid Ryugu

Spacecraft shadow, and a dark irregular spot, on the surface of a rocky asteroid.

Japan’s Hayabusa-2 spacecraft captured this image last week, during its ascent after touchdown on asteroid Ryugu. You can see the shadow of Hayabusa2 and a region of the surface of the asteroid apparently discolored by the touchdown. Image via JAXA (@haya2e_jaxa on Twitter).

The Japan Aerospace Exploration Agency (JAXA) released this image this week, following its February 20 to 22 touchdown operation on the surface of distant asteroid Ryugu. Japan’s Hayabusa2 spacecraft performed the brief touchdown, and its wide-angle Optical Navigation Camera captured the image as the craft was ascending again from the asteroid’s surface. The spacecraft’s shadow is cool to see! All this is happening 200 million miles (300 million km) from Earth, after all. Even more interesting – to space scientists – is the discoloration on the asteroid’s surface. See it? That large, irregular, dark spot? The scientists said the spot could have been caused by grit being blown upwards by the spacecraft’s thrusters, or by the “bullet” the craft fired into the asteroid’s surface in order to puff up dust for sample collection. Hayabusa2’s mission is to collect samples of rock from asteroid Ryugu for eventual delivery to Earth.

Hayabusa-2 arrived at Ryugu in June 2018 after a 1.9-billion-mile (3.2-billion-km) journey.

Last week’s initial touchdown on the asteroid’s surface was said to be a complex procedure that nonetheless took less time than expected and appeared to go without a hitch. The firing of the bullet into the asteroid’s surface was the first of three such firings planned for this mission. Hayabusa2 mission manager Makoto Yoshikawa commented last week that he believed this technique for sample return would:

… lead to a leap, or new discoveries, in planetary science.

Read more via the BBC

Read more via JAXA

Bottom line: An image showing touchdown marks on asteroid Ryugu, from Japan’s Hayabusa2 spacecraft.


from EarthSky https://ift.tt/2Ezu7tG

Now is the time to see Mercury

Chart showing Mercury and Mars in the west after sunset.

View larger. | At its farthest from the sun in our evening sky in late February and early March 2019, Mercury stands above the sunset point. Notice Mars, too! Chart via Guy Ottewell.

Mercury now stands farthest out from the sun, in the evening sky. Technically, we say that the planet is at its greatest eastward elongation. The extreme is reached on February 27, 2019 at 01:00 UTC. This is back in February 26 by American clocks – 8 p.m. for the Eastern time zone, 7 p.m. for the Central, and so on. The precise clock time is not so important. What’s important is that you look for the elusive little planet in the west shortly after sunset on these late February 2019 evenings, if the low sky is clear.

On the chart above, the arrows through Mercury and Mars show their movement (against the starry background) from 2 days before to 2 days after February 26.

The broad arrow on the celestial equator shows how far the sky appears to rotate in one hour. So Mercury will be down to the horizon in less than an hour after sunset, as seen from the latitude of this map (40 degrees N. latitude).

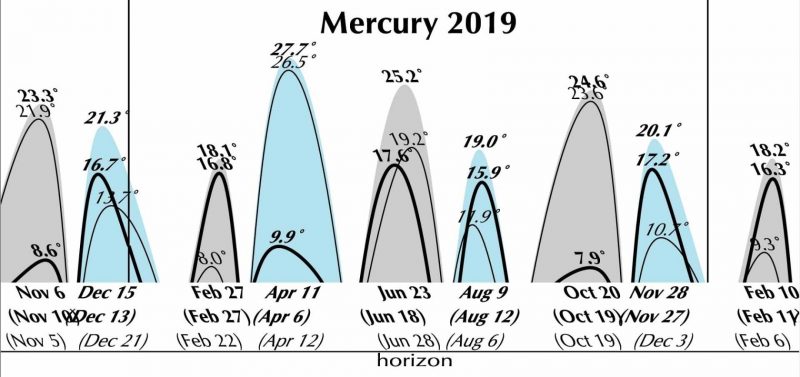
Now look at the chart below, which shows Mercury’s elongations from the sun – the best times to view the planet – for all of 2019.

Graph showing Mercury's elongations from the sun in 2019.

View larger. | Here are the year’s apparitions of Mercury compared: 3 swings out from the neighborhood of the sun into the evening sky (gray) and 3 into the morning sky (blue). The top figures are the maximum elongations – maximum apparent distance from the sun – reached at the top dates given beneath. Curving lines show the altitude of the planet above the horizon at sunrise or sunset, for latitude 40 degrees North (thick line) and 35 degrees South (thin), with maxima reached at the parenthesized dates below (40 degrees North bold). Chart via Guy Ottewell.

You can see that for February 27 the elongation is not particularly great (18.1°). However, the thick curve almost fits up to the gray area. That is, the sunset altitude, for north-hemisphere observers, is almost as great as the elongation.

The reason for this favorabie geometry is clear in the sky scene at the top of this post. Mercury’s travel away from the sun appears vertical with respect to the horizon. It roughly follows the ecliptic, or sun’s path across our sky, which at this season – for temperate latitude in the Northern Hemisphere – is nearly vertical. And it also happens that Mercury, in this part of its orbit, is sloping slightly northward from the ecliptic.

It’s said that Copernicus, who made us understand that the planets revolve around the sun, was never able to see little Mercury from misty Poland. Perhaps you can research this for me and tell us whether it is just a Polish joke or an urban-pollution myth.

Bottom line: For the Northern Hemisphere, the best evening apparition of Mercury in 2019 comes in late February. Now is the time to look.


from EarthSky https://ift.tt/2ExjPua