ASCO 2019 cancer news: Day 1 – the annual blood test debate

blood samples

The world’s cancer specialists have landed in Chicago again to meet, discuss and share the latest in cancer prevention, diagnosis and treatment. Close to 40,000 doctors and experts are gathering for the American Society for Clinical Oncology (ASCO) Annual Meeting, the largest cancer conference in the world.

The research on show makes headlines. Lots of them. And this media coverage comes with several notes of caution. Most of the results being shared at the conference are a preliminary look at ongoing clinical trials, and in some cases those trials are at an early stage. The researchers are also tasked with delivering these updates in incredibly short talks. This, combined with the media’s hunt for a good story, means that details can sometimes be missed, confusingly presented or the scale and stage of a study not always made clear.

So, to help you judge the media stories for yourself, we’ve written this 6-point cheat sheet on what to look out for.

We’ll also be sharing a daily update of the latest headlines, and you can follow along with the conference on Twitter using #ASCO19.

Day 1 – Friday 31 May

Blood test next steps

Each year there are column inches dedicated to discussing whether now is the time that a ‘simple blood test’ for cancer has appeared on the scientific horizon. Day one of ASCO 2019 proved that this year is no exception. And, much like last year, the conclusion remains that there’s still a long way to go.

One company that many have their eye on, called GRAIL, released a glimpse of new, unpublished data ahead of a few of its conference presentations that was picked up by the media. Their goal is to develop a blood test for 12 types of cancer that can also say where in the body the cancer is growing. And there are 2 main takeaways from the latest data, which come from pilot studies of the test in 1,422 people known to have cancer and 879 who have not been diagnosed:

  1. So far, the experimental test can detect cancers with varying degrees of success across the 12 types – and the sensitivity ranged from detecting 34% of stage 1 cancers to 84% of stage 3, which could prove important if this is to become a test to detect cancers early.
  2. Of the cancers the test detected, it also correctly flagged where in the body the cancer had originally started growing in 9 in 10 cases.

GRAIL says these latest results show how they’re reaching a point where a balance can be struck between the test being sensitive enough to detect most cancers while minimising the chance that it suggests someone has cancer when they don’t. Trials with large numbers of people will be needed before it’s clear if that’s the case, and the company is already planning those. But there is a long way to go.

STAT News had an in-depth piece on the results if you have a subscription, as did Fierce Biotech.

Nick Peel, from the ASCO Annual Meeting in Chicago.


from Cancer Research UK – Science blog http://bit.ly/2KpubzJ

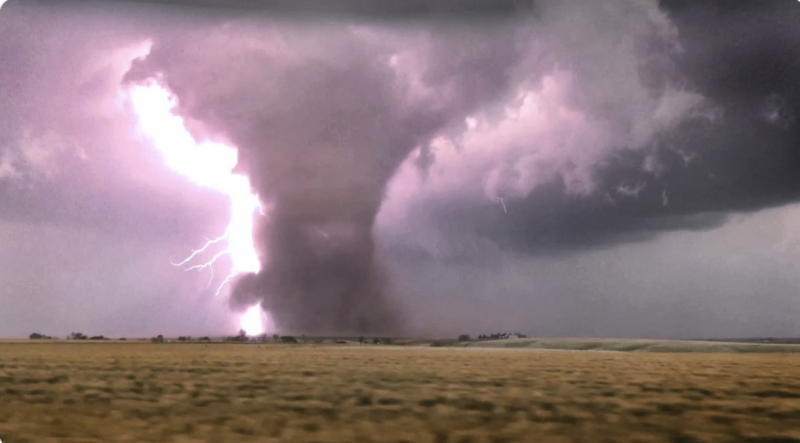
Tornado near Edmond, Oklahoma

A large, backlit tornado moving across the Oklahoma prairie.

Tom Smetana (@twstdbro on Twitter) captured this image near Edmond, Oklahoma on May 17, 2019. For tornado updates, also follow Reed Timmer (@ReedTimmerAccu on Twitter).

Read more from The Atlantic: The Hybrid System That Spots Tornadoes


from EarthSky http://bit.ly/2MmAg2f

Lung cancer deaths in women are increasing globally. It’s a hidden but preventable epidemic

The use of tobacco products, like smoking cigarettes, is the leading preventable cause of cancer worldwide. And lung cancer is still a leading cause of global deaths.

But while the number of men dying from lung cancer is starting to fall, recent figures suggest that the number of women dying from the disease around the world is still increasing.

Today, like every May 31st since 1987, is World No Tobacco Day. And this year’s theme of lung health and tobacco makes it all the more relevant to try and unpick this trend.

Big Tobacco’s marketing tactics increase tobacco sales to women

It’s hard to pinpoint one reason to explain this shift, though tobacco industry tactics such as the marketing of tobacco products, can partly explain this rise in female lung cancer deaths. This includes marketing products in a way that will appeal directly to women, making smoking seem like a glamorous and empowering habit. These tactics can’t be used in the UK as, like many other countries, the Government has prohibited virtually all tobacco advertising. However, there are many countries including China, the Philippines and India, where this is still not the case.

Before we can start to explain why we are we seeing more women dying from lung cancer we need to think about what is meant by ‘gender’.

Professor Sarah Hawkes of the Institute of Global Health at the University College London, and Global Health 50/50, is an expert on gender and health. She says gender, unlike sex, is what society makes you into. “It’s malleable and flexible and throughout our lives we are surrounded by situations and drivers that will change how we identify and express our own gender”.

And gender is a key driver behind smoking.

“No one” she says, “understands this better than commercial industries.”

Professor Hawkes has spent much of her career researching the impact of gender on health. Her research on tobacco has highlighted how profoundly the two factors can influence one another.

According to Hawkes, women are a prime target for the tobacco industry for two major reasons.

The tobacco industry are masters of understanding how to manipulate gender norms to increase their profits.

– Professor Hawkes, Institute of Global Health UCL

Firstly, 80% of the world’s smokers live in low-and-middle income countries. And some of these countries are experiencing economic growth, meaning more women are able to afford tobacco.

And in countries experiencing economic growth, more women are moving from rural parts of the countries into cities, where smoking is more common. “Educated women in urban Mumbai (India) for example, are more likely to be smokers than young women in rural Maharashtra,” she says. These factors lead to an uptake in tobacco use.

Second, the industry understands and takes advantage of changing gender roles. Just like industries who capitalised on societally-defined differences between men and women, including the marketing of ‘girls’ and ‘boys’ toys, the tobacco industry has used a series of tactics to take advantage of the way countries define gender to drive sales of its products. For example, by creating female branded packs that promote attributes such as slimness, glamour and attractiveness.

But they’ve not stopped there. The tobacco industry has also designed products to appeal to women at different stages of their life and fostered the false idea that tobacco is linked to empowerment.

Cigarette brands for younger women emphasise confidence, freedom and independence, while those marketed towards older women drew on themes of relaxation and escape from daily stresses.

Who societies think ‘should’ or ‘shouldn’t’ smoke has also been influenced by the tobacco industry. “You might believe that [smoking] is a symbol of independence, because a commercial company is telling you this story. Particularly if you live in a country where in your grandparents’ generation men were the only ones allowed to smoke,” says Hawkes.

It’s not just smoking

It’s not just women starting to smoke that’s behind this trend. 64% of those who die from exposure to second-hand smoke are women.

Women have the highest exposure to second hand smoke at home and in the work place. This is often a result of their limited ability to negotiate against their domestic roles, unequal power relationships and restricted living circumstances.

With more women dying from lung cancer than ever before, we need to better understand the links between gender and health.

How can we buck the trend?

“We need to join the dots,” says Professor Hawkes, making a plea to policy makers that it’s time to understand how complex the determinants of ill-health are.

It’s not a coincidence that more women are dying from lung cancer.

The tobacco industry understands that factors like gender can have a significant influence on how people use or are exposed to tobacco. So we need to make efforts to understand this too.

And if we incorporate an understanding of factors like gender into tobacco control programmes, we could help to prevent women and children’s exposure to second hand smoke.

Take Australia and Canada for example. They’ve helped to reduce the risk of second hand smoke by taking into consideration what it means to be a good father in their country and playing on that perception.

But innovative initiatives like this are few and far between, as Professor Hawkes explains. “I’ve spent a lot of time collecting evidence on the impact of gender on health then wondering why this evidence wasn’t making it into policy change”.

We are seeing more governments enforce policies such as bans on tobacco advertising, promotion and sponsporship. But we need to see more of this in countries where the tobacco industry increasingly operates.

“The tobacco industry are masters of understanding how to manipulate gender norms to increase their profits” Professor Hawkes explains.

The onus is on us to be just as good at understanding how factors like gender are causing the global smoking epidemic to spread. And to help us stop it.

Priscilla Tiigah is a Policy and Research Advisor at Cancer Researck UK

Read more about the International Cancer Prevention Programme at Cancer Research UK


from Cancer Research UK – Science blog http://bit.ly/2WGwll2

The use of tobacco products, like smoking cigarettes, is the leading preventable cause of cancer worldwide. And lung cancer is still a leading cause of global deaths.

But while the number of men dying from lung cancer is starting to fall, recent figures suggest that the number of women dying from the disease around the world is still increasing.

Today, like every May 31st since 1987, is World No Tobacco Day. And this year’s theme of lung health and tobacco makes it all the more relevant to try and unpick this trend.

Big Tobacco’s marketing tactics increase tobacco sales to women

It’s hard to pinpoint one reason to explain this shift, though tobacco industry tactics such as the marketing of tobacco products, can partly explain this rise in female lung cancer deaths. This includes marketing products in a way that will appeal directly to women, making smoking seem like a glamorous and empowering habit. These tactics can’t be used in the UK as, like many other countries, the Government has prohibited virtually all tobacco advertising. However, there are many countries including China, the Philippines and India, where this is still not the case.

Before we can start to explain why we are we seeing more women dying from lung cancer we need to think about what is meant by ‘gender’.

Professor Sarah Hawkes of the Institute of Global Health at the University College London, and Global Health 50/50, is an expert on gender and health. She says gender, unlike sex, is what society makes you into. “It’s malleable and flexible and throughout our lives we are surrounded by situations and drivers that will change how we identify and express our own gender”.

And gender is a key driver behind smoking.

“No one” she says, “understands this better than commercial industries.”

Professor Hawkes has spent much of her career researching the impact of gender on health. Her research on tobacco has highlighted how profoundly the two factors can influence one another.

According to Hawkes, women are a prime target for the tobacco industry for two major reasons.

The tobacco industry are masters of understanding how to manipulate gender norms to increase their profits.

– Professor Hawkes, Institute of Global Health UCL

Firstly, 80% of the world’s smokers live in low-and-middle income countries. And some of these countries are experiencing economic growth, meaning more women are able to afford tobacco.

And in countries experiencing economic growth, more women are moving from rural parts of the countries into cities, where smoking is more common. “Educated women in urban Mumbai (India) for example, are more likely to be smokers than young women in rural Maharashtra,” she says. These factors lead to an uptake in tobacco use.

Second, the industry understands and takes advantage of changing gender roles. Just like industries who capitalised on societally-defined differences between men and women, including the marketing of ‘girls’ and ‘boys’ toys, the tobacco industry has used a series of tactics to take advantage of the way countries define gender to drive sales of its products. For example, by creating female branded packs that promote attributes such as slimness, glamour and attractiveness.

But they’ve not stopped there. The tobacco industry has also designed products to appeal to women at different stages of their life and fostered the false idea that tobacco is linked to empowerment.

Cigarette brands for younger women emphasise confidence, freedom and independence, while those marketed towards older women drew on themes of relaxation and escape from daily stresses.

Who societies think ‘should’ or ‘shouldn’t’ smoke has also been influenced by the tobacco industry. “You might believe that [smoking] is a symbol of independence, because a commercial company is telling you this story. Particularly if you live in a country where in your grandparents’ generation men were the only ones allowed to smoke,” says Hawkes.

It’s not just smoking

It’s not just women starting to smoke that’s behind this trend. 64% of those who die from exposure to second-hand smoke are women.

Women have the highest exposure to second hand smoke at home and in the work place. This is often a result of their limited ability to negotiate against their domestic roles, unequal power relationships and restricted living circumstances.

With more women dying from lung cancer than ever before, we need to better understand the links between gender and health.

How can we buck the trend?

“We need to join the dots,” says Professor Hawkes, making a plea to policy makers that it’s time to understand how complex the determinants of ill-health are.

It’s not a coincidence that more women are dying from lung cancer.

The tobacco industry understands that factors like gender can have a significant influence on how people use or are exposed to tobacco. So we need to make efforts to understand this too.

And if we incorporate an understanding of factors like gender into tobacco control programmes, we could help to prevent women and children’s exposure to second hand smoke.

Take Australia and Canada for example. They’ve helped to reduce the risk of second hand smoke by taking into consideration what it means to be a good father in their country and playing on that perception.

But innovative initiatives like this are few and far between, as Professor Hawkes explains. “I’ve spent a lot of time collecting evidence on the impact of gender on health then wondering why this evidence wasn’t making it into policy change”.

We are seeing more governments enforce policies such as bans on tobacco advertising, promotion and sponsporship. But we need to see more of this in countries where the tobacco industry increasingly operates.

“The tobacco industry are masters of understanding how to manipulate gender norms to increase their profits” Professor Hawkes explains.

The onus is on us to be just as good at understanding how factors like gender are causing the global smoking epidemic to spread. And to help us stop it.

Priscilla Tiigah is a Policy and Research Advisor at Cancer Researck UK

Read more about the International Cancer Prevention Programme at Cancer Research UK


from Cancer Research UK – Science blog http://bit.ly/2WGwll2

It’s hurricane season: 4 things to know

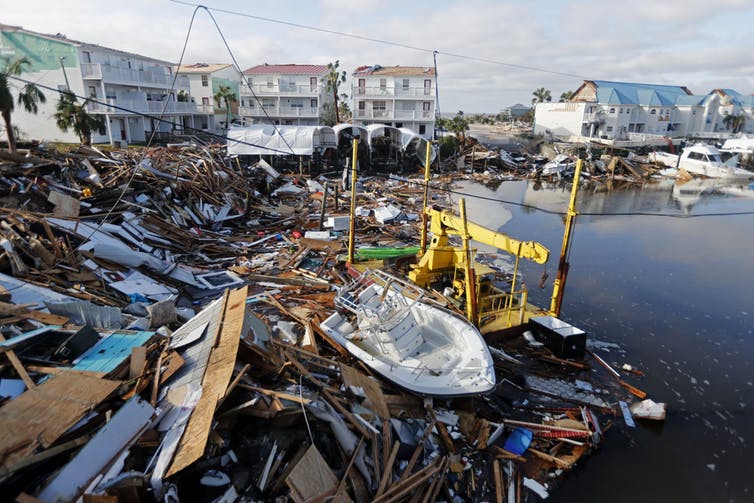
Smashed and crushed boat and wood debris at the edge of a bay under a blue sky.

Debris in a boatyard in Mexico Beach, Florida, on October 11, 2018, after Hurricane Michael heavily damaged the town. Image via AP Photo/Gerald Herbert, File

By Jennifer Weeks, The Conversation

The official Atlantic hurricane season begins on June 1, even as many communities are still recovering from a destructive year in 2018. Hurricane Florence swamped much of the Carolinas in September, followed by Hurricane Michael, which battered the Florida Panhandle less than a month later. Together, these two storms killed at least 113 people and caused billions of dollars in damages.

For 2019, federal forecasters are predicting a “near-normal” hurricane season, with nine to 15 named storms expected to form and two to four of them developing into major hurricanes. But as weather experts warn, it only takes one storm making landfall to make it an active season for people in harm’s way. Here are five expert takes on preparing for whatever the 2019 hurricane season brings.

1. How forecasters make predictions

We rely on expert forecasters to tell us how strong hurricanes will be, the odds that they will make landfall and where they’re most likely to come ashore. But how do stormcasters develop judgments from enormous quantities of data?

As Florida State University meteorologists Mark Bourassa and Vasu Misra explain, models – complex software packages that run on large computers – are essential. But models’ results don’t always agree with each other. That’s why forecasters use collections of storm models instead of just one. And they may tweak certain assumptions built into the models to account for uncertainty about conditions in a particular storm.

Storm track forecasts have become much more accurate in recent decades, but predictions of storm intensity have changed little. That’s because it’s hard to capture all the variables that determine storm intensity. “Models are inexact in their descriptions of the entire state of the atmosphere and ocean at the start time of the model,” Bourassa and Misra acknowledge – a point worth remembering if a storm heads in your direction.

2. Should I stay or should I go?

If a hurricane is approaching, should you leave? It’s a complicated question, especially when evacuations are recommended but not mandatory. Residents have to weigh the economic and emotional costs of relocating against damage forecasts that may be changing hourly.

Government officials feel the pressure when they have to decide whether to order people out of town. University of South Carolina geographer Susan Cutter calls these decisions

… part science, part skill based on experience, and part luck.

Constituents may be angry if they evacuate and the storm misses their area – but leaving people in harm’s way is clearly a worse prospect.

Planners base evacuation decisions on many factors beyond storm forecasts, Cutter writes. They also consider road networks, demographics, and whether and how quickly residents are likely to follow orders. Cutter notes:

It is hard to predict the path of hurricanes, and even more so the behavior of people in response to them.

3. The risks extend inland

A hurricane is bearing down on the Atlantic or Gulf coast, but you’re on vacation in the mountains. Should you track the forecasts?

Louisiana State University geographer Craig Colten’s response is an emphatic yes. As Colten has found in his research on water in the U.S. South, the risk of catastrophic flooding during and after hurricanes extends many miles inland. However, communities away from the shore often are not as well prepared for these emergencies.

Geography makes the U.S. eastern seaboard highly vulnerable to river flooding from tropical storms, Colten shows. He said:

From New England to Georgia, a dense network of rivers flows down from the eastern Appalachians across the Piedmont – a broad, rolling plateau extending from the mountains to the coastal plain – and drains into the Atlantic Ocean. Steep gradients move water quickly down the mountain slopes.

When hurricanes and tropical storms move inland, they meet the steep face of the Blue Ridge Mountains and rise, cooling and releasing huge quantities of rain. These deluges, he said

… funnel into river networks and rush toward the sea, often spilling over the banks of overwhelmed channels.

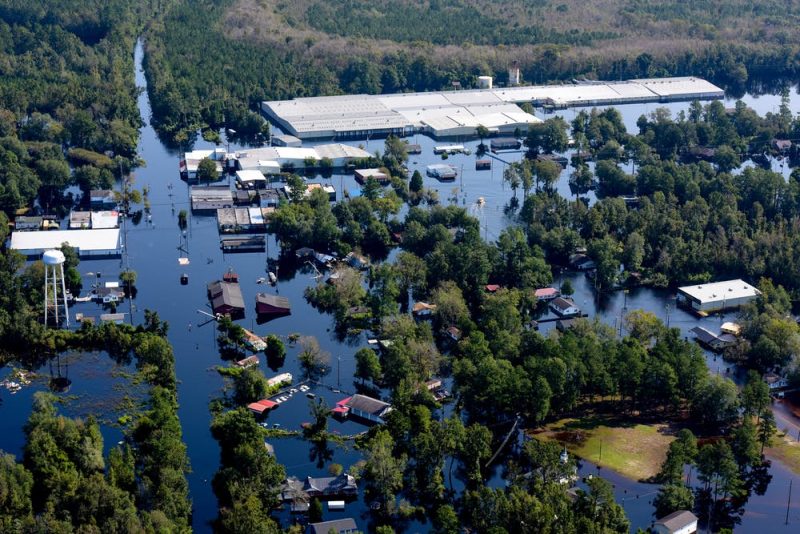
This pattern was readily apparent in September 2018 when Hurricane Florence dumped 20 to 30 inches of rain on many parts of North Carolina, setting flood records at 28 different locations.

Aerial view of flooded landscape, blue water surrounding half-submerged buildings.

Flooding in South Carolina after Hurricane Florence, September 21, 2018. Image via U.S. National Guard/Senior Airman Megan Floyd

4. Your social networks can help or hurt you

Social media can be extremely helpful during a disaster. Apps deliver weather updates, public service announcements and directions to the nearest gas station that still has fuel. People can use Facebook or Twitter to call for help when they’re cut off from roads or lose power, and emergency managers use them to organize and deliver food and medical supplies.

But when Northeastern University political scientist Daniel Aldrich analyzed how people’s social networks of friends and relatives influenced choices about evacuating, he found more nuanced results. People with extended, far-flung social networks were more likely to evacuate in advance of an oncoming storm, Aldrich observed:

In contrast, we found that having stronger bonding ties – that is, family and friends – made people less likely to evacuate leading up to a hurricane. In our view, this is a critical insight. People whose immediate, close networks are strong may feel supported and better-prepared to weather the storm.

Strong networks are invaluable for anyone weathering the stress of a major disaster. However, Aldrich’s research suggests that a person who sees others in her immediate, close network staying in place may opt not to evacuate, when heeding warnings from public officials would be a better, albeit less natural, choice.

This article is a round-up of stories from The Conversation’s archive.

Jennifer Weeks, Environment + Energy Editor, The Conversation

This article is republished from The Conversation under a Creative Commons license. Read the original article.

Bottom line: For hurricane season 2019: How forecasters make predictions, whether to stay or evacuate, what kinds of risks extend inland, and how your social networks can help or hurt you.

The Conversation


from EarthSky http://bit.ly/2wtFHSb

How do hurricanes get their names?

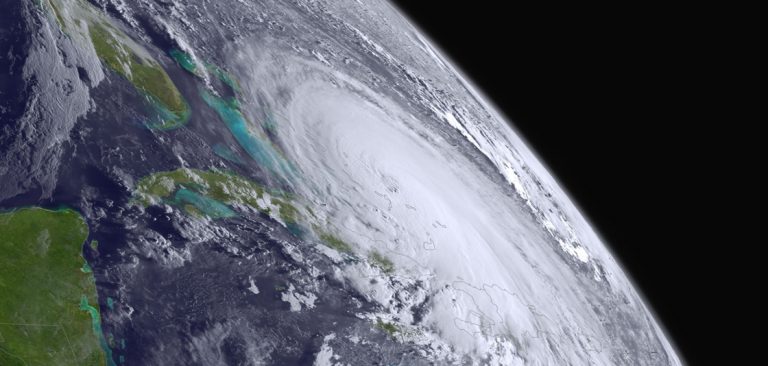
Oblique orbital view of very wide round storm with spot in middle.

The Atlantic hurricane season begins on June 1 and ends November 30.

Ever wonder how hurricanes get their names? And why do hurricanes have names at all? Meteorologists long ago learned that naming tropical storms and hurricanes helps people remember the storms, communicate about them more effectively, and so stay safer if and when a particular storm strikes a coast. These experts assign names to hurricanes according to a formal list of names that is approved prior to the start of each hurricane season. The U.S. National Hurricane Center started this practice in the early 1950s. Now, the World Meteorological Organization generates and maintains the list of hurricane names.

Here are the hurricane names for 2019:

Atlantic hurricane names are Andrea, Barry, Chantal, Dorian, Erin, Fernand, Gabrielle, Humberto, Imelda, Jerry, Karen, Lorenzo, Melissa, Nestor, Olga, Pablo, Rebekah, Sebastien, Tanya, Van, and Wendy. The Atlantic hurricane season runs from June 1 to November 30.

Eastern North Pacific hurricane names are Alvin, Barbara, Cosme, Dalila, Erick, Flossie, Gil, Henriette, Ivo, Juliette, Kiko, Lorena, Mario, Narda, Octave, Priscilla, Raymond, Sonia, Tico, Velma, Wallis, Xina, York, and Zelda. The eastern North Pacific hurricane season runs from May 15 to November 30.

If you’re interested, you can view those names, and names for upcoming years, here.

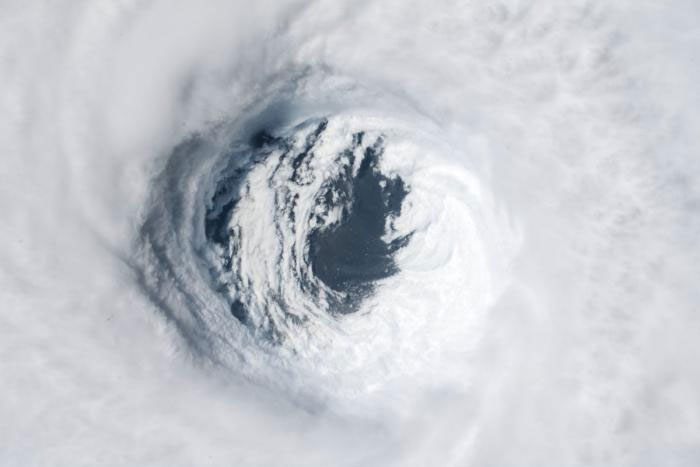
Huge swirling mass of clouds with dark hold in center.

The eyewall of Hurricane Michael photographed on October 10, 2018, by astronauts onboard the International Space Station. Hurricane Michael was a category 5 storm when it made landfall in the vicinity of Mexico Beach, Florida, on October 10. Image via NASA.

How and why did hurricanes first begin receiving names? While people have been naming major storms for hundreds of years, most hurricanes were originally designated by a system of latitude-longitude numbers, which was useful to meteorologists trying to track these storms. Unfortunately, this system was confusing to people living on coasts seeking hurricane information.

In the early 1950s, a formal practice for storm naming was first developed for the Atlantic Ocean by the U.S. National Hurricane Center. At that time, storms were named according to a phonetic alphabet (e.g., Able, Baker, Charlie) and the names used were the same for each hurricane season; in other words, the first hurricane of a season was always named “Able,” the second “Baker,” and so on.

In 1953, to avoid the repetitive use of names, the system was revised so that storms would be given female names. By doing this, the National Weather Service was mimicking the habit of naval meteorologists, who named the storms after women, much as ships at sea were traditionally named for women.

In 1978–1979, the system was revised again to include both female and male hurricane names.

See the complete history of naming hurricanes, from NOAA

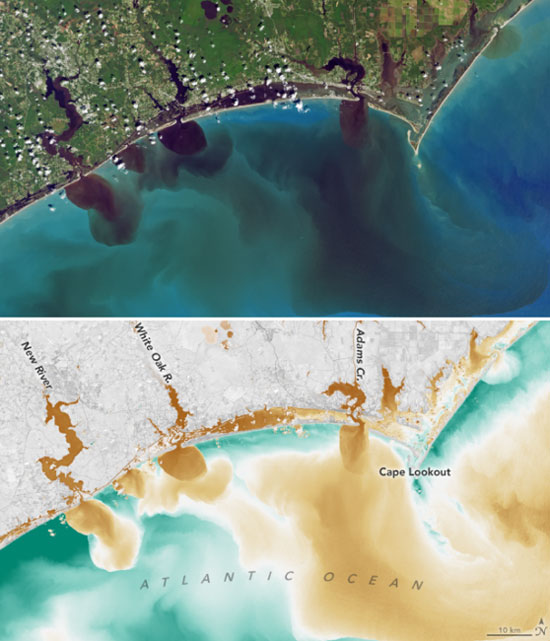
Coastline with blooms of darker water coming out from river mouths.

Debris being washed offshore in the flooding caused by Hurricane Florence. The imagery was captured by USGS’s Landsat 8 satellite. Hurricane Florence was only a category 1 storm when it finally made landfall near Wrightsville Beach, North Carolina, on September 14, 2018, but the slow-moving storm caused devastating flooding. Image via NASA.

When does a storm receive a name? Tropical storms are given names when they display a rotating circulation pattern and wind speeds of 39 miles per hour (63 kilometers per hour). A tropical storm develops into a hurricane when wind speeds reach 74 mph (119 kph).

Lists of hurricane names have been developed for many of the major ocean basins around the world. Today, there are six lists of hurricane names in use for Atlantic Ocean and Eastern North Pacific storms. These lists rotate, one each year. That means the list of this year’s hurricane names for each basin will come up again six years from now. There’s an exception to this practice, however. The names of hurricanes that are particularly damaging are retired for legal, cultural sensitivity, and historical reasons. For example, the use of the name Katrina was retired in 2005 following the devastating impact that Hurricane Katrina had on New Orleans. In March 2019, the World Meteorological Organization removed the names Florence and Michael from its lists for the Atlantic Ocean basin and replaced the names with Francine and Milton. Hurricanes Florence and Michael, which respectively struck the coasts of North Carolina and Florida in 2018, each caused tremendous damage and dozens of fatalities.

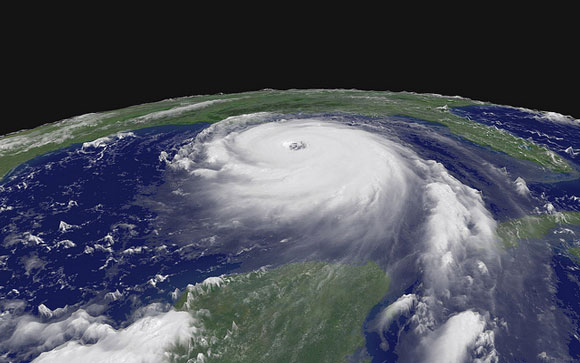
Oblique orbital view of large round white hurricane with distinct spirals and eye.

Hurricane Katrina on August 28, 2005. Image via NASA.

Bottom line: The World Meteorological Organization manages the formal system by which hurricanes receive their names. The names for each ocean area are published in lists prior to the hurricane season. Find hurricane names for 2019 here.

Help EarthSky keep going! Please donate.


from EarthSky http://bit.ly/2Q0SO6s

Historical hurricane tracks

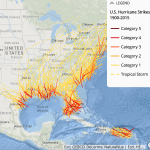
East coast map. Very many red lines into coastline continuing as orange and yellow.

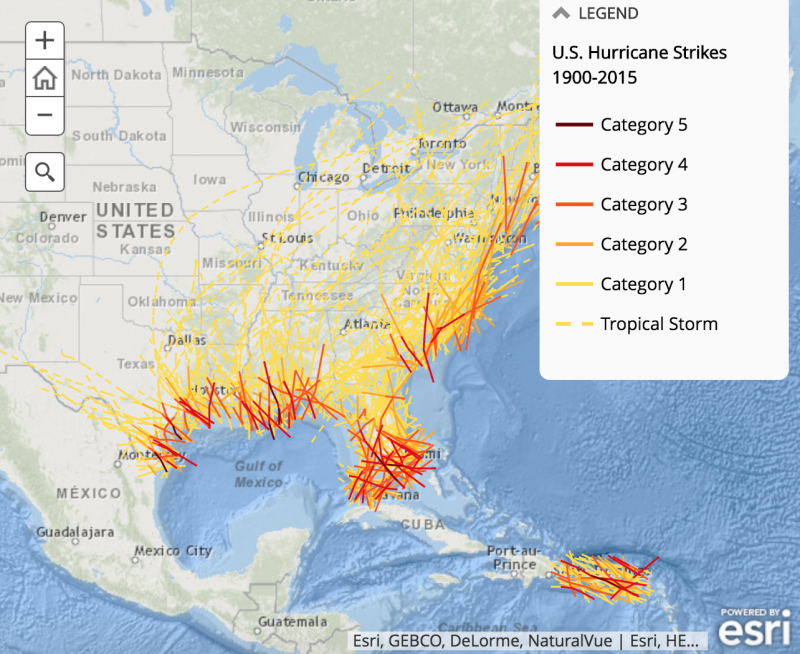
View larger. | Hurricane tracks over a 115-year interval. Each of these storm systems reached hurricane strength while the storm center was within 50 nautical miles of the U.S. coastline. Image via EPA.

Map showing hurricane tracks that reached the U.S. East Coast, Florida, Gulf Coast, and Puerto Rico area from 1900 to 2015. You can zoom in on this map, see other parts of the world, and find more interactive maps and information here.


from EarthSky http://bit.ly/2Xfe0It

April 2019 2nd hottest on record for globe

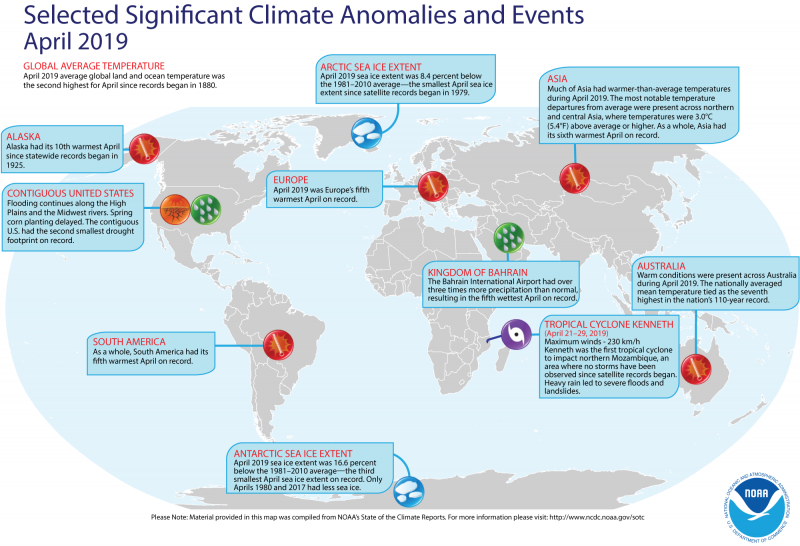
Map of the world with description boxes showing climate anomalies.

View larger. | An annotated map of the world showing notable climate events that occurred in April 2019. Image via NOAA.

Earth continues to warm, and last month was no exception.

Despite the cool springtime weather for some of us in the U.S., globally April 2019 was the second-hottest April in the climate record, dating back to 1880, according to NOAA’s April 2019 Global Climate Report. The Arctic region wasn’t spared either, as sea ice coverage shrank to a record low for the month.

The average global temperature in April was 1.67 degrees Fahrenheit (.9 degrees Celsius) above the 20th-century average of 56.7 degrees F (13.7 degrees C), making it the second-hottest April in the 140-year record, behind April 2016. Last month also was the 43rd consecutive April and 412th consecutive month that saw above-average global temperatures.

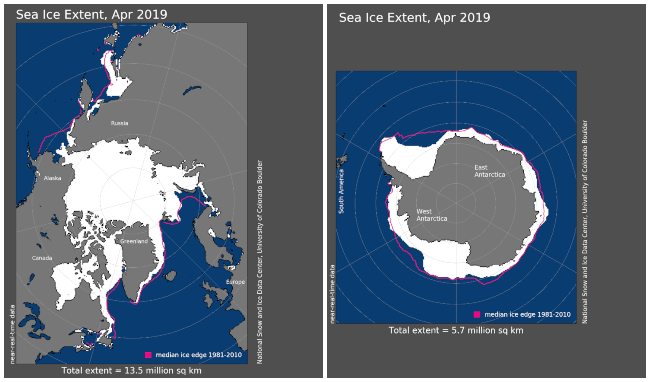
Map of Arctic and Antarctic showing extent of ice.

April 2019 marked the 18th consecutive April with Arctic sea ice extent below average. This was the smallest Arctic sea ice extent for April in the 41-year record at 8.4% below the 1981–2010 average and 89,000 square miles (230,500 sq km) below the previous record low set in April 2016, according to an analysis by the National Snow and Ice Data Center using data from NOAA and NASA. Image via NOAA.

Here are some highlights from NOAA’s latest monthly global climate report (read the full report here):

The period from January through April produced a global temperature 1.62 degrees F (.9 degrees C) above the average of 54.8 degrees F (12.7 degrees C), which is the third-hottest year-to-date on record. The record-warm temperatures for the four-month period were registered in parts of Australia, southeastern Brazil, central Asia, the southern Atlantic and southwestern Indian oceans and the Barents, East China and Tasman seas.
Sea ice shrank markedly at both poles: Average Arctic sea ice coverage (extent) in April was 8.4 percent below the 1981-2010 average – the lowest for April on record. The Antarctic sea ice extent was 16.6 percent below average, the third smallest for April on record.

Canadian coolness reached southward: Cooler-than-average temperatures were logged from January through April across much of Canada and the north-central U.S., about 3.6 degrees F (2 degrees C) below average.

March 2019 was also the 2nd hottest March on record for the globe.

Bottom line: NOAA reports that April 2019 was the second-hottest April on record. In the Arctic, sea ice coverage shrank to a record low for the month. The period from January through April was the thirrd-hottest year-to-date on record.

Via NOAA


from EarthSky http://bit.ly/2I5avhA

Springtime in northern Europe starting earlier and earlier

Closeup of new, unfolding leaves growing from a twig.

Spring leaf out. Image via Carodean Road Designs/Flickr.

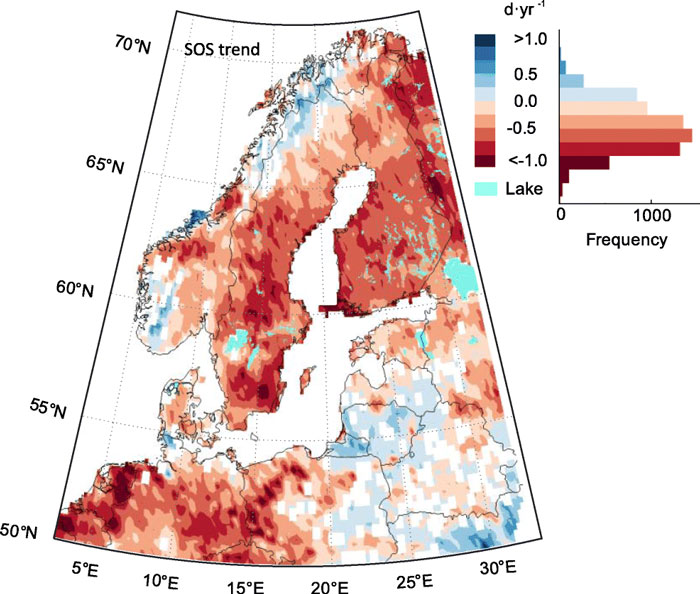
By using satellite data, scientists have discovered that the start of the spring growing season has advanced across northern Europe over the past two decades. Overall, the start of the growing season has advanced by 0.3 days per year during 2000 to 2016 in response to variations in temperature and precipitation, according to the new research.

These new research results on spring phenology changes in northern Europe were published in the June 2019 issue of the International Journal of Biometeorology.

Phenology has been defined as the study of nature’s calendar. When flowers bloom in the spring, when birds migrate north to breed, when deciduous forests turn colors in the fall, when bats and bears hibernate at the onset of winter; these cyclical seasonal phenomena as well as many others are encompassed within the broad scope of phenology. Because many of these cycles are sensitive to temperature cues, climate warming can cause subtle alterations in them.

Presently, a number of direct observations of vegetation growth have shown that the start of the growing season has advanced at several locations across western Europe. To get a broader view of the changes that are occurring in this region, a team of scientists from Sweden turned their attention to satellite data.

The scientists used a new index called the plant phenology index (PPI), which is better at dealing with snow and better at capturing changes in leaves within dense canopies than traditional indices, to study changes in the start of the spring growing season across all of northern Europe. Studies to date using traditional indices have obtained inconsistent results about changes in spring phenology across Europe and the Northern Hemisphere. The new PPI was calculated with satellite data obtained by MODIS (Moderate Resolution Imaging Spectroradiometer), which is an instrument installed on NASA’s Terra and Aqua satellites. MODIS captures imagery data at every location on Earth every one to two days. The PPI data have been shown to be highly correlated with the gross primary productivity of vegetation.

The PPI analyses showed that the start of the spring growing season has advanced by 0.3 days per year over 2000 to 2016 in northern Europe. While both variations in temperature and precipitation contributed to these changes, the phenology changes were most sensitive to subtle changes in temperature. The scientists estimate the start of the growing season in northern Europe has a sensitivity of about 2.47 days per degree Celsius (1.8 degrees Fahrenheit). Similar sensitivity estimates for other regions around the world currently range from 2.2 to 7.5 days per degree Celsius.

Scandinavia and northern Europe with large swaths of red.

Map showing the advances (red colors) in the start of the growing season (SOS) in northern Europe. Image via Jin et al. (2019) Int. J. Biometeorol., volume 63, pp. 763–775.

Collectively, these studies are enabling scientists to better forecast how vegetation will respond to a warming climate. In particular, earlier growing seasons may be a concern to farmers because fragile orchards that bloom too early may suffer frost damage. Problems may also arise because of mismatches between the timing of peak plant food availability and the activities of hungry animals.

Hongxiao Jin, lead author of the new study, is a postdoctoral fellow in the Department of Physical Geography and Ecosystem Science at Lund University. Coauthors of the paper included Anna Maria Jönsson, Cecilia Olsson, Johan Lindström, Per Jönsson, and Lars Eklundh.

Bottom line: Spring is coming earlier to northern Europe according to new research from Swedish scientists.

Source: New satellite-based estimates show significant trends in spring phenology and complex sensitivities to temperature and precipitation at northern European latitudes


from EarthSky http://bit.ly/2KcGfE3

Mars 2020 landing site

Abstract-looking mix of colors, gray, purple, green

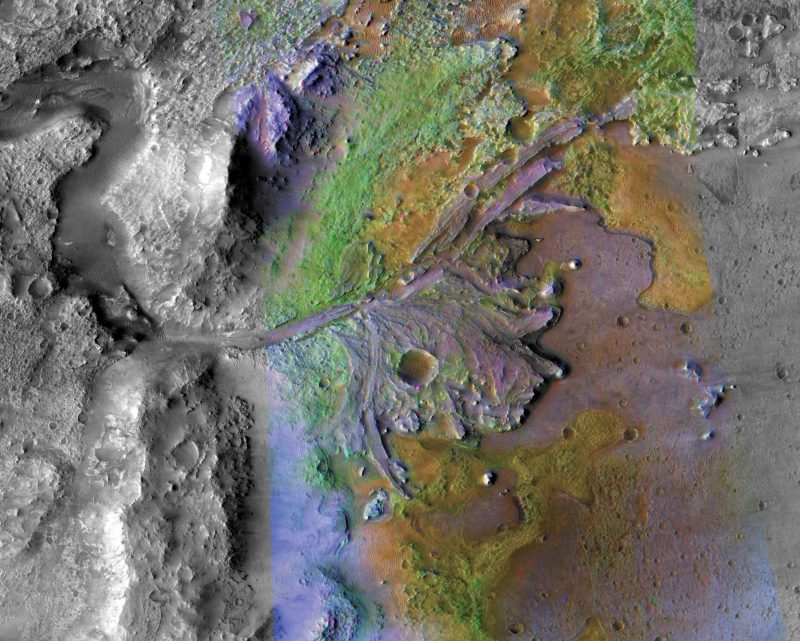
This image was taken by instruments on NASA’s Mars Reconnaissance Orbiter, which regularly takes images of potential landing sites for future missions. Image via NASA/JPL-Caltech/ASU.

This is Jezero crater on Mars, the planned landing site for NASA’s Mars 2020 rover mission. Here’s how NASA described the area:

On ancient Mars, water carved channels and transported sediments to form fans and deltas within lake basins. Examination of spectral data acquired from orbit show that some of these sediments have minerals that indicate chemical alteration by water. Here in Jezero Crater delta, sediments contain clays and carbonates.

The Mrs 2020 mission is timed for a launch opportunity in July/August 2020 when Earth and Mars are in good positions relative to each other for landing on Mars. That’s because it takes less power to travel to Mars at this time, compared to other times when Earth and Mars are in different positions in their orbit

Bottom line; Image of Jezero crater, the planned landing site for NASA’s Mars 2020 mission.

Via NASA


from EarthSky http://bit.ly/2I1YdGA

It’s time for Manhattanhenge in NYC

Manhattanhenge. This is a 3-image composite to preserve the disk of the sun and also shadow details of the surroundings. Gowrishankar Lakshminarayanan was in Gantry Plaza State Park, Queens, New York, looking straight through 42nd Street, with the Chrysler building to the right, on June 1, 2017.

Every year around May 29 and 30 – and again for a day or two around July 12 – people in New York City look forward to Manhattanhenge. It’s a phenomenon where the sunset aligns perfectly with the streets of Manhattan, particularly along 42nd, 34th and 14th Streets. It happens twice every year – around the end of May and early July. May 29th and 30th are the most talked-about dates in media, but – as the photo above by Gowrishankar Lakshminarayanan shows, you don’t have to look precisely May 29 and 30. He captured the image above on June 1, 2017.

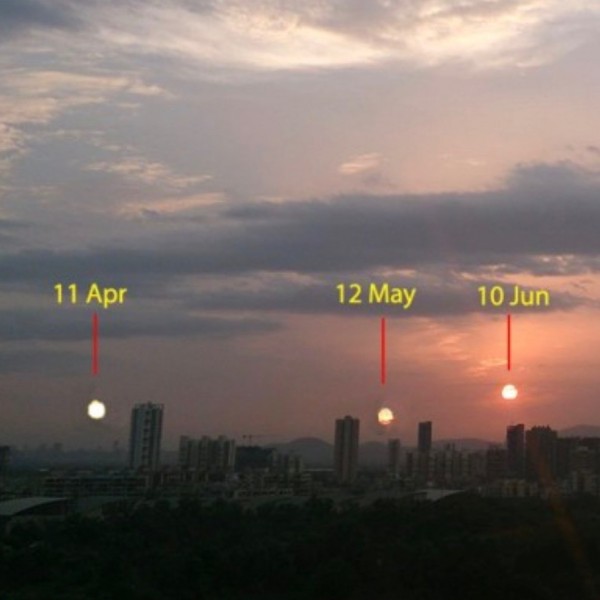
The phenomenon of Manhattanhenge is fun, one of similar alignments that occur around the world, on various dates. Think Stonehenge at the equinoxes and solstices. The point of sunset along the horizon varies throughout the year. At this time of year – between the March equinox and June solstice – the sunset point is shifting northward each day on the horizon, as seen from around the globe. It’s the northward-shifting path of the sun that gives us summer in the Northern Hemisphere and winter in the Southern Hemisphere. And it’s the shifting path of the sun that gives people various alignments of the sunset with familiar landmarks.

We heard that 2018’s Manhattenhenge was obscured by clouds. Today’s forecast today for NYC calls for mostly cloudy skies, too, with severe storms possible. That’s easy to believe after last night’s lightning show over NYC. Still, if the skies clear at just the right time, there could be some dramatic photo opportunities!

Read more: Manhattanhenge 2019: When and where to watch

Abhijit Juvekar in Dombivli, India, created this composite image of sunsets over a period of months, to show that the sun sets progressively farther north in the months leading up to the June solstice.

The June solstice on June 21 will bring the sun’s northernmost point in our sky – and northernmost sunset – and afterwards the sun’s path in our sky, and the sunset point, will both start shifting southward again. As for the sun’s alignment with the city of New York, and the streets of Manhattan Island … well, thank the original planners of this city. Scientific American explained:

The phenomenon is based on a design for Manhattan outlined in The Commissioners’ Plan of 1811 for a rectilinear grid, or “gridiron” of straight streets and avenues that intersect one another at right angles. This design runs from north of Houston Street in Lower Manhattan to just south of 155th Street in Upper Manhattan. Most cross streets in between were arranged in a regular right-angled grid that was tilted 29 degrees east of true north to roughly replicate the angle of the island of Manhattan.

And because of this 29-degree tilt in the grid, the magic moment of the setting sun aligning with Manhattan’s cross streets does not coincide with the June solstice but rather with specific dates in late May and early July.

Read more about Manhattanhenge from ScientificAmerican.com

Bottom line: Each year on May 29 and 30, New Yorkers watch for Manhattanhenge. Here’s what causes it.


from EarthSky http://bit.ly/2WtUwmA

Today in science: Einstein’s triumph

Black circular silhouette of new moon, surrounded by solar corona, during a total solar eclipse.

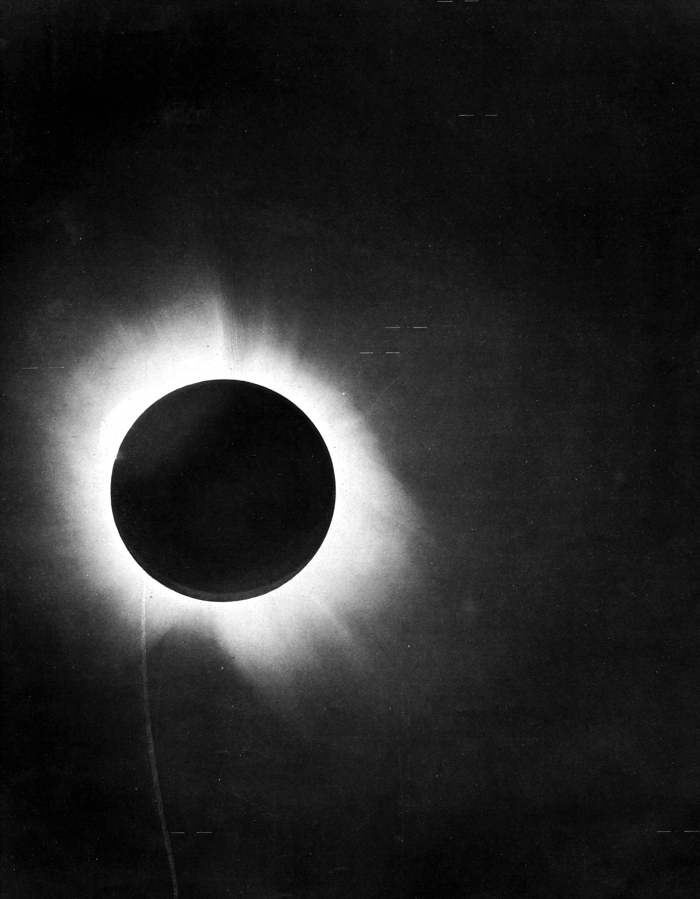
One of Sir Arthur Eddington’s photographs of the total solar eclipse of May 29, 1919. Eddington’s observations during this eclipse proved Einstein’s prediction of the bending of light around the sun. Notice the tick marks around stars near the eclipsed sun. It was the precise measurement of the positions of these stars with respect to the edge of the sun that proved Einstein’s theory. Image via Wikimedia Commons.

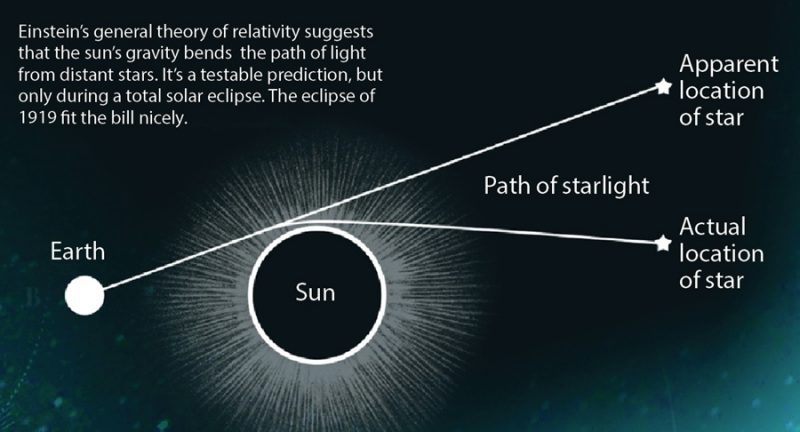
May 29, 1919. Today is the 100th anniversary of a total solar eclipse used to test Albert Einstein’s revolutionary theory of gravity, known as general relativity. Einstein himself was relatively unknown at the time. He’d proposed general relativity in 1915, and scientists had been intrigued by the entirely new way of thinking about gravity – for example, the idea that mass causes space to curve – but no one had proven Einstein correct. Then, on May 29, 1919, an expedition of English scientists – led by Sir Arthur Eddington – traveled to the island of Principe off the west coast of Africa to observe a total solar eclipse. The scientists’ measurements during the eclipse showed that, astoundingly, Einstein’s predictions were correct. Stars could be seen at the edge of the sun during the eclipse, while the moon blocked the sun’s light. The stars’ locations appeared displaced, due to the fact that their light had to travel to us, not on a straight path, but on the curved space around the sun, as described by Einstein.

Later that year – on November 6, 1919, in London – England’s Astronomer Royal Frank Dyson presented the results at a joint meeting of the Royal Astronomical Society and the Royal Society. Dyson said “there can be no doubt” that measurements made during the May 29, 1919, solar eclipse “confirm Einstein’s prediction.” In a recent story celebrating the 100th anniversary of this legendary solar eclipse, Caltech physicist Sean Carroll explained to NBCNews:

General relativity was the poster child for being a crazy, new, hard-to-understand theory, with dramatic implications for the nature of reality. And yet you could see [the results]; you could photograph it. So people got caught up in that excitement.

And so Albert Einstein was catapulted to rock star fame, to a status in popular culture he has retained ever since.

Diagram of Sun, star, Earth. Straight line from us to a star's apparent location and a bent line to its actual location.

Diagram showing what the English astronomers measured in 1919. They saw stars that should have been hidden behind the sun located to one side of the sun. Why? Because – just as Einstein’s theory said it should – light bends in the presence of mass, in this case the mass of a star, our sun. Rather than traveling a straight path, the light of distant stars was forced to travel a curved path on the curved space near the sun. Image via GSFC/NASA/DiscoverMagazine.com.

Einstein’s general theory of relativity underlies our most basic modern cosmology, our way of looking at the universe as a whole. Before Einstein, scientists relied on Isaac Newton’s theory of gravity, and Newton’s way of looking at gravity is still valid and is still taught to physics students. Einstein’s theory is a refinement of scientists’ understanding of gravity … and what a mind-blowing refinement! Einstein proposed that mass causes space to curve. So, for example, although there appears to be a “force” (as described by Newton) that causes our Earth to be pulled towards the sun by gravity, in fact, there’s no such force. According to Einstein, Earth is simply traveling in curved space around the sun.

Einstein’s general theory of relativity not only explains the motion of Earth and the other planets in our solar system. In our modern cosmology, it also describes extreme examples of curved space, such as that around black holes. And it helps to describe the history and expansion of the universe as a whole.

In the century since the 1919 total solar eclipse, Einstein’s relativity theory has been proven again and again, in many different ways. You might have seen the recent first-ever photo of a black hole?. It also proved, once again, that Einstein was right.

Read more: Black hole image confirms Einstein’s relativity theory

Read more: Clocks, gravity and the limits of relativity

Glowing, fuzzy orange donut with black center.

This image captured people’s imaginations earlier this year, when it was first released: the first-ever real photo of a giant black hole, in the center of galaxy M87. This image also proves Einstein’s theory, which predicted the observations from M87 with unerring accuracy. Image via Event Horizon Telescope Collaboration.

The Royal Astronomical Society (RAS) recently spoke of modern-day practical applications of Einstein’s theory:

The theory fundamentally changed our understanding of physics and astronomy, and underpins critical modern technologies such as the satellite-based Global Positioning System (GPS).

The theory of relativity is essential for the correct operation of GPS systems, which in turn are relied on in many common applications including vehicle satellite navigation (SatNav) systems, weather forecasting, and disaster relief and emergency services. However, the world had to wait decades before the applications of such a blue skies result could be realized.

The RAS also said that celebrations are underway across the globe to commemorate 100 years since the U.K.-led expedition confirmed Einstein’s theory. It said:

A series of public events in the U.K. and around the world will mark this seminal anniversary.

… Celebratory activities will be taking place in the U.K., Portugal, Principe, Sobral and around the world: more information on all of the events can be found on the Eclipse 1919 events page.

Mike Cruise, President of the Royal Astronomical Society, said:

A century ago astronomers confirmed the general theory of relativity – in the process transforming our understanding of the universe forever. The work of Einstein and Eddington is an amazing example of international collaboration in the aftermath of the first world war, and a visible demonstration of how science can overcome barriers in these turbulent times.

In November the RAS and Royal Society will host a conference and public event marking the 100th anniversary of the announcement of the results. The commemoration forms part of the centenary of the International Astronomical Union, founded in 1919, with more than 200 schools around the world signed up to explore the role of gravity in astronomy.

A dark-haired man with a mustache and a dignified expression, in a suit.

Albert Einstein in 1912.

Bottom line: On May 29, 1919, astronomer Sir Arthur Eddington verified Einstein’s general theory of relativity by observing the apparent deflection of stars from their normal positions during a solar eclipse. This happens because, according to Einstein’s theory, the path of light is bent by gravity when it travels close to a massive object like our sun.

Via RAS, NBCNews, DiscoverMagazine.com


from EarthSky http://bit.ly/2I513Lf

Clocks, gravity and the limits of relativity

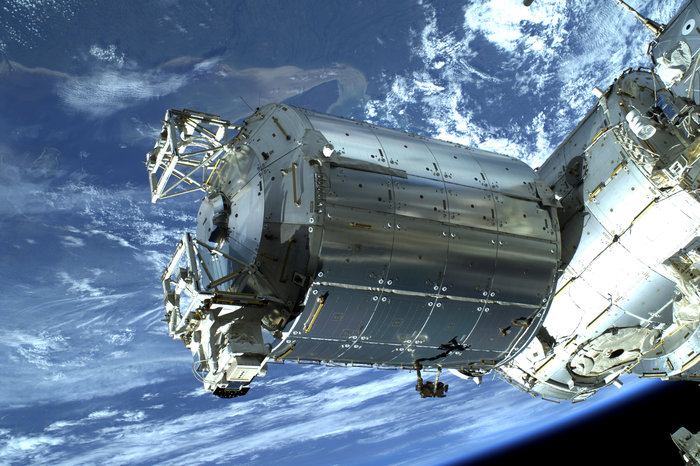
Shiny silver cylindrical spacecraft in front of blue planet Earth.

This image of Europe’s Columbus space laboratory was taken by ESA astronaut Luca Parmitano during his spacewalk on July 9, 2013. Image via ESA/NASA.

Via ESA

The International Space Station will host the most precise clocks ever to leave Earth. Accurate to a second in 300 million years, the clocks will push the measurement of time to test the limits of the theory of relativity and our understanding of gravity.

Albert Einstein’s general theory of relativity predicted that gravity and speed influences time; the faster you travel the more time slows down, but also the more gravity pulling on you the more time slows down.

A white circle, surrounded by an uneven area of black rays, all on a gray background.

Negative photo of the 1919 solar eclipse. Image via Royal Astronomical Society.

On May 29, 1919, Einstein’s theory was first put to the test when Arthur Eddington observed light “bending” around the sun during a solar eclipse. Forty years later, the Pound-Rebka experiment first measured the redshift effect induced by gravity in a laboratory – but a century later scientists are still searching for the limits of the theory.

Luigi Cacciapuoti, ESA’s Atomic Clock Ensemble in Space (ACES) project scientist, explained:

The theory of relativity describes our universe on the large scale, but on the border with the infinitesimally small scale the theory does not jibe and it remains inconsistent with quantum mechanics. Today’s attempts at unifying general relativity and quantum mechanics predict violations of the Einstein’s equivalence principle.

Einstein’s principle details how gravity interferes with time and space. One of its most interesting manifestations is time dilation due to gravity. This effect has been proven by comparing clocks at different altitudes such as on mountains, in valleys and in space. Clocks at higher altitudes show time passes faster with respect to a clock on the Earth’s surface, as there is less gravity from Earth the farther you are from our planet.

Flying at a 250 mile (400 km) altitude on the Space Station, the Atomic Clock Ensemble in Space will make more precise measurements than ever before.

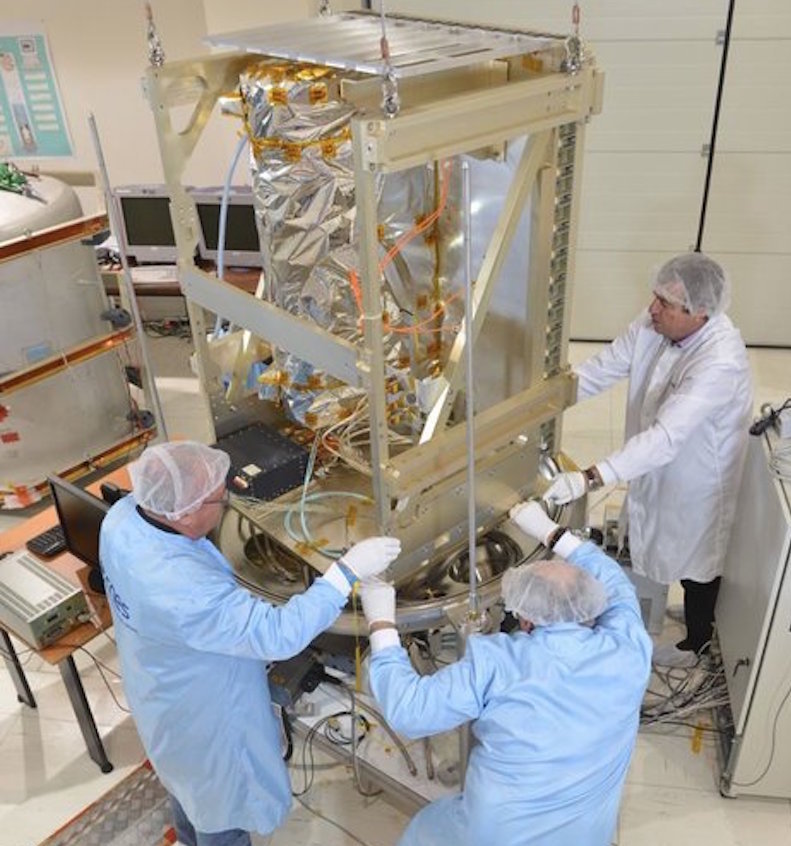
Men in lab coats, hairnets and white gloves holding onto a large metal structure.

ACES clock. Image via CNES.

Internet of clocks

ACES will create an “internet of clocks”, connecting the most accurate atomic timepieces the world over and compare their timekeeping with the ones on humankind’s weightless laboratory as it flies overhead.

Comparing time down to a stability of hundreds femtoseconds – one millionth of a billionth of a second – requires techniques that push the limits of current technology. ACES has two ways for the clocks to transmit their data, a microwave link and an optical link. Both connections exchange two-way timing signals between the ground stations and the space terminal, when the timing signal heads upwards to the Space Station and when it returns down to Earth.

The unprecedented accuracy this setup offers brings some nice bonuses to the ACES experiment. Clocks on the ground will be compared among themselves providing local measurements of geopotential differences, helping scientists to study our planet and its gravity.

The frequencies of the laser and microwave links will help understand how light and radio waves propagate through the troposphere and ionosphere, thus providing information on climate. Finally, the internet of clocks will allow scientists to distribute time and to synchronize their clocks worldwide for large-scale Earth-based experiments and for other applications that require precise timing.

Shiny cylindrical spacecraft with gold boxes attached against black space.

Columbus module with ACES. Image via ESA–D. Ducros.

Luigi said:

The next generation of atomic clocks and the link techniques that we are developing could one day be used to observe gravitational waves themselves as ESA’s proposed LISA mission, but right now ACES will help us test as best we can Einstein’s theory of general relativity, searching for tiny violations that, if found, might open a window to a new theory of physics that must come.

The clocks have been tested and integrated on the ACES payload and the microwave link for ACES is undergoing tests before final integration with the full experiment. ACES will be ready for launch to the Space Station by 2020.

Bottom line: Einstein’s theory of gravity was first put to the test when Arthur Eddington observed light “bending” around the sun during a solar eclipse. A century later, scientists are still searching for the limits of the theory.


from EarthSky http://bit.ly/2EFF5xx

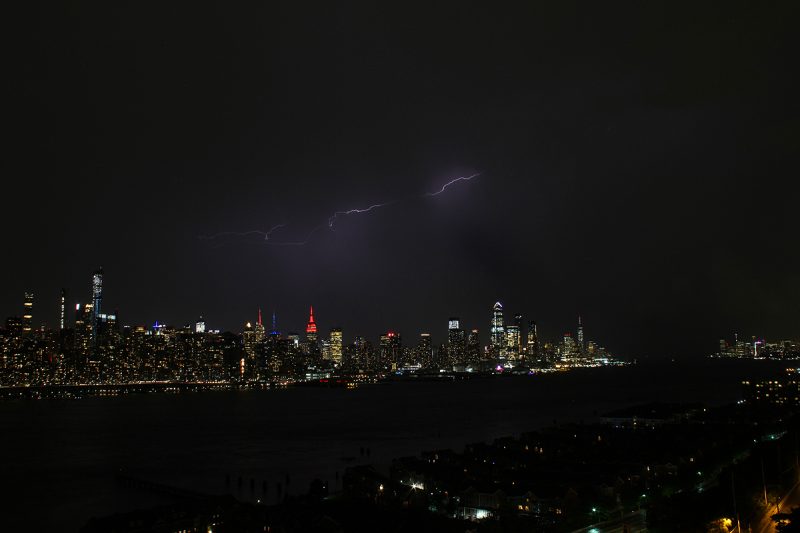
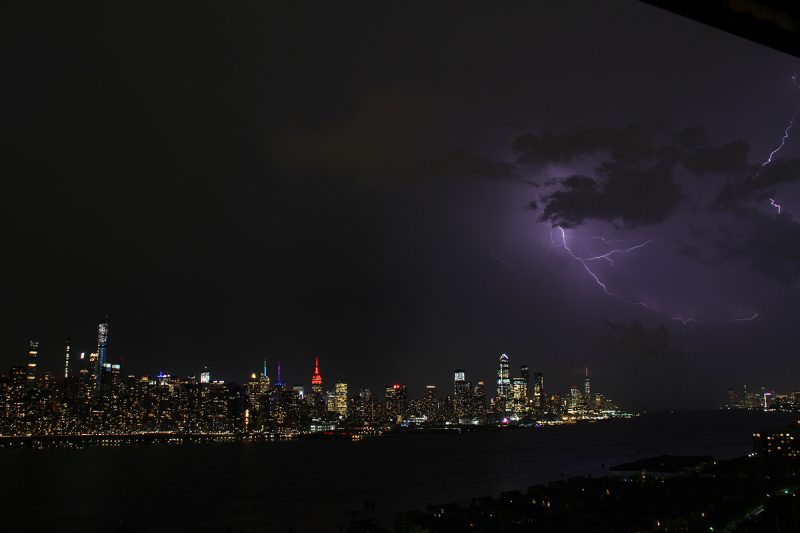
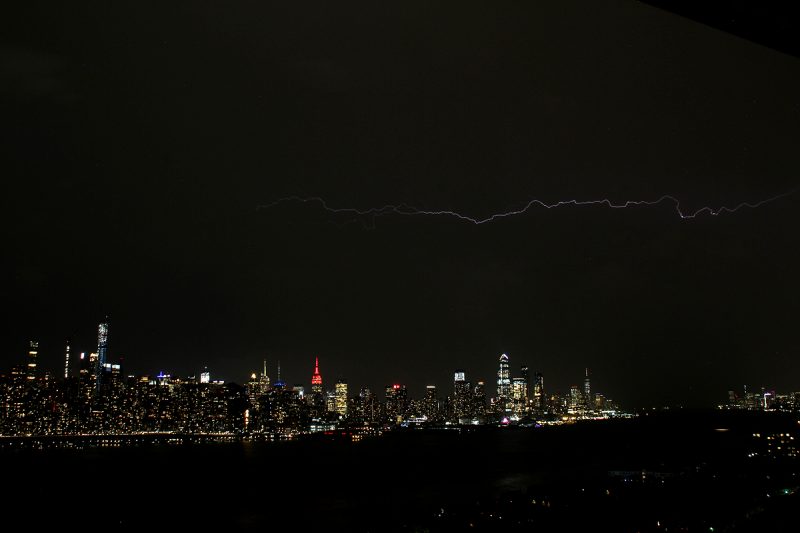
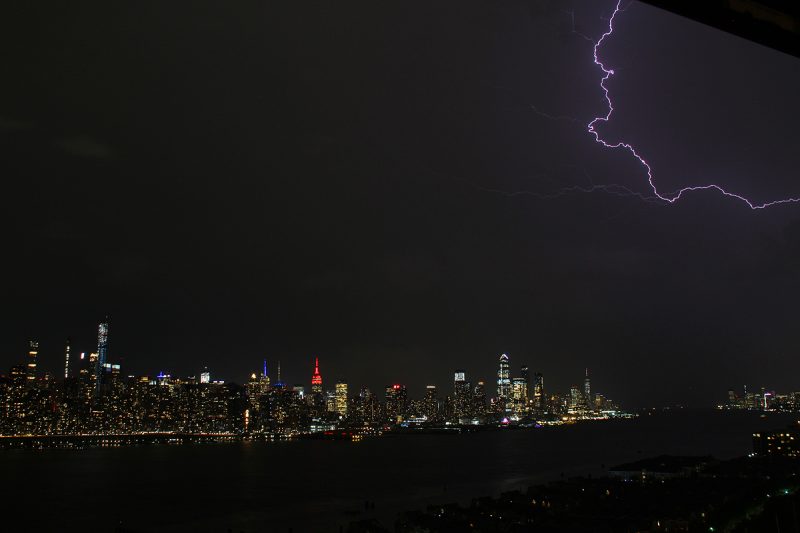
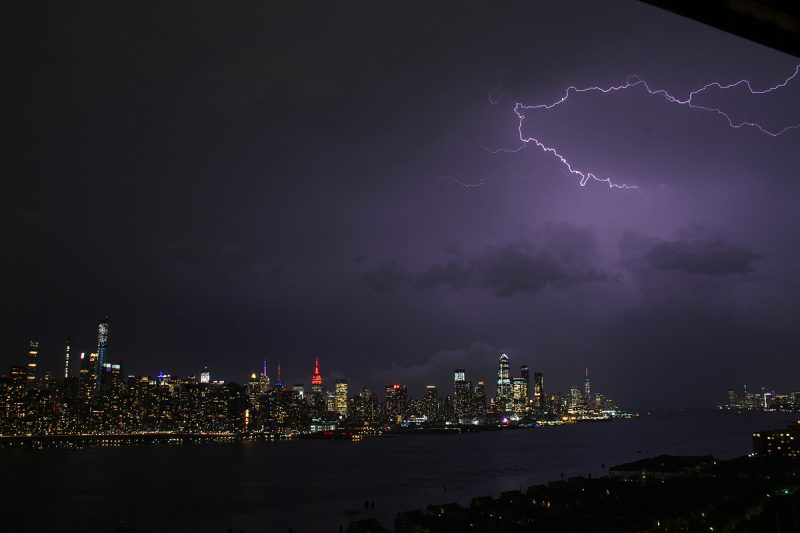
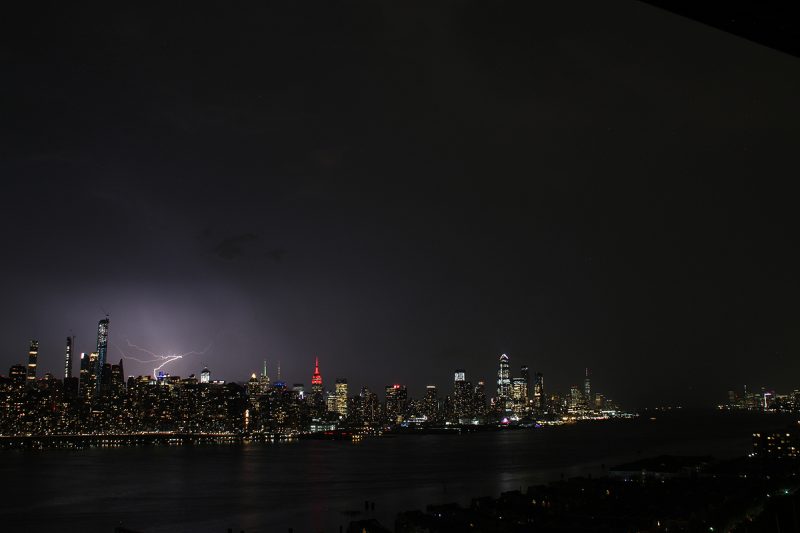
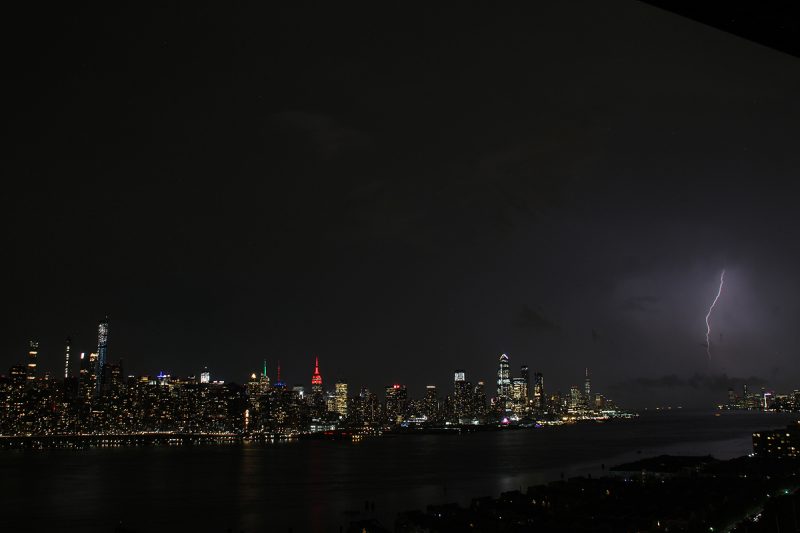
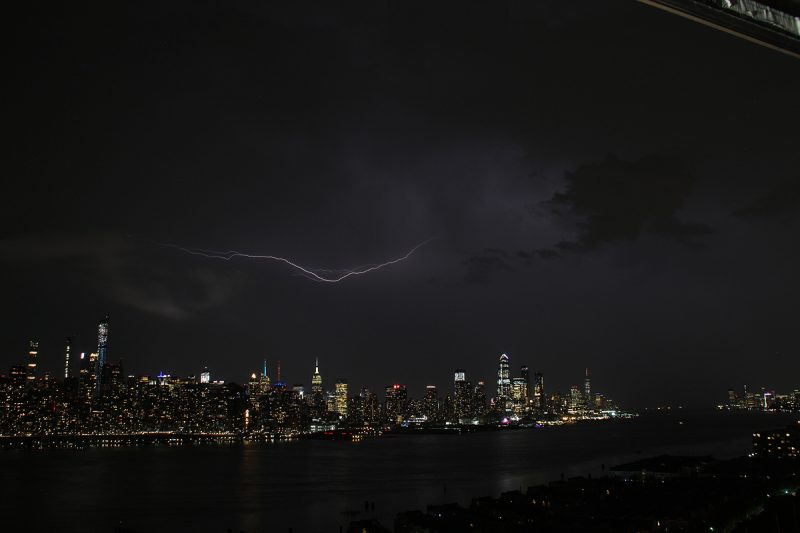
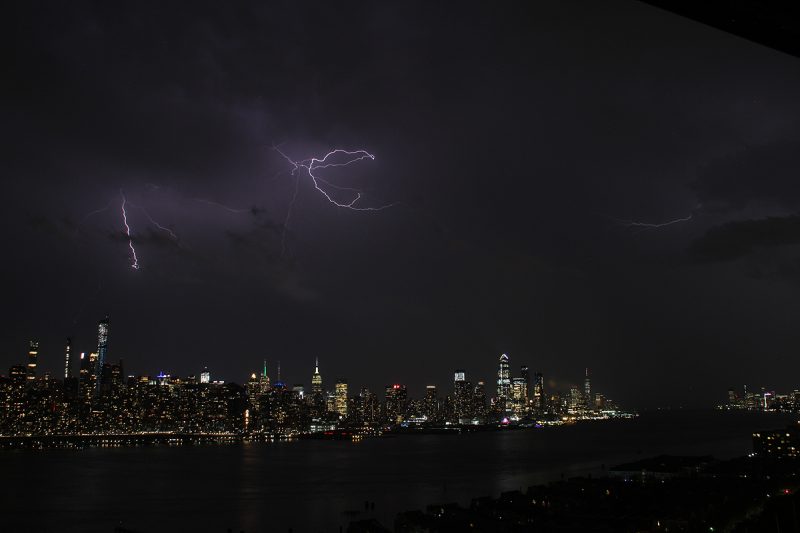
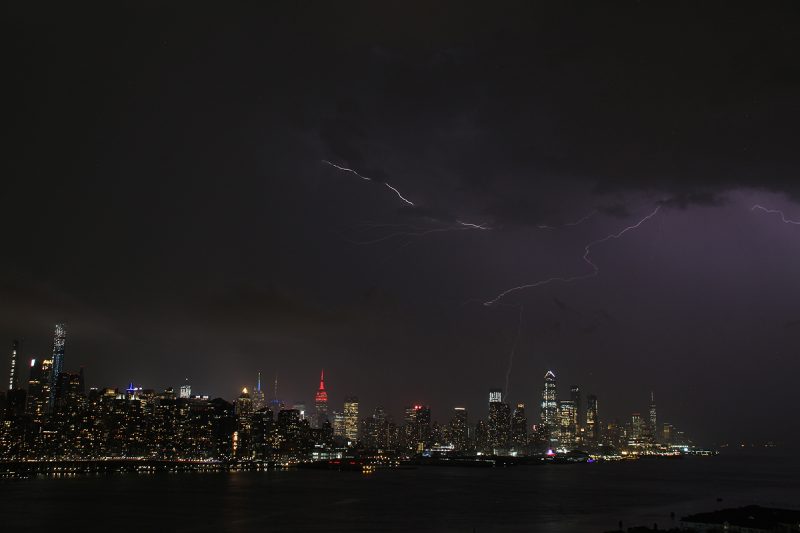
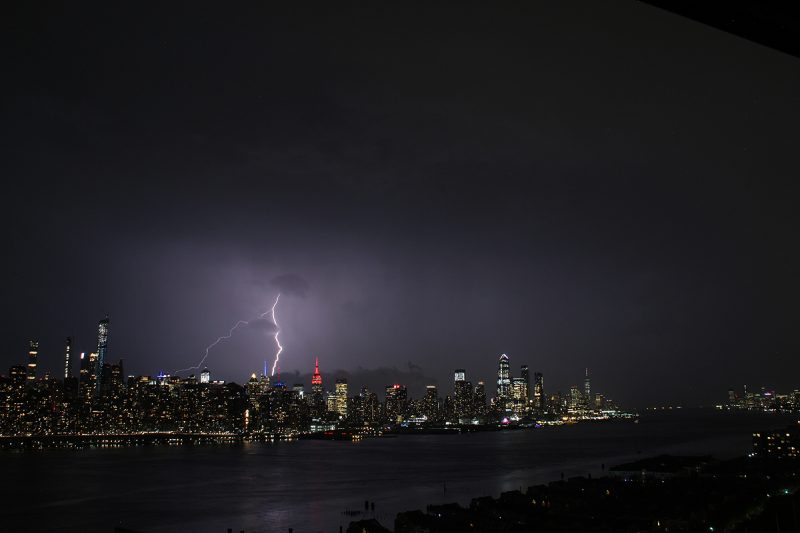
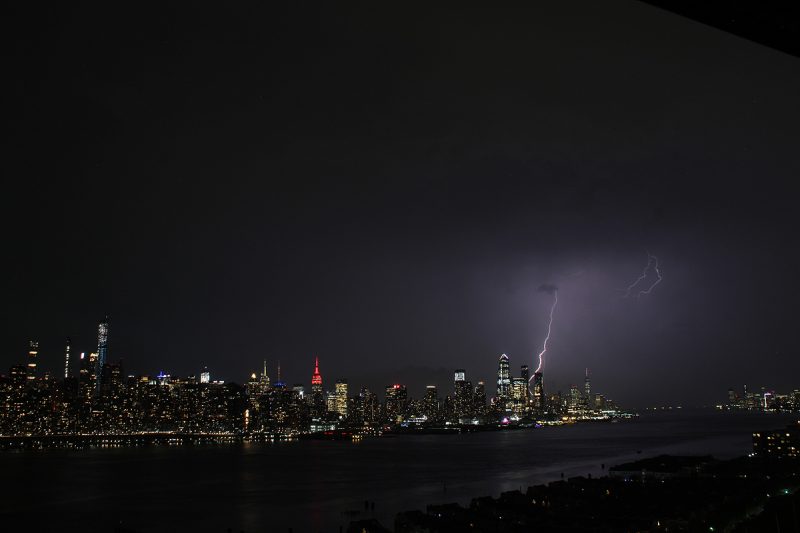
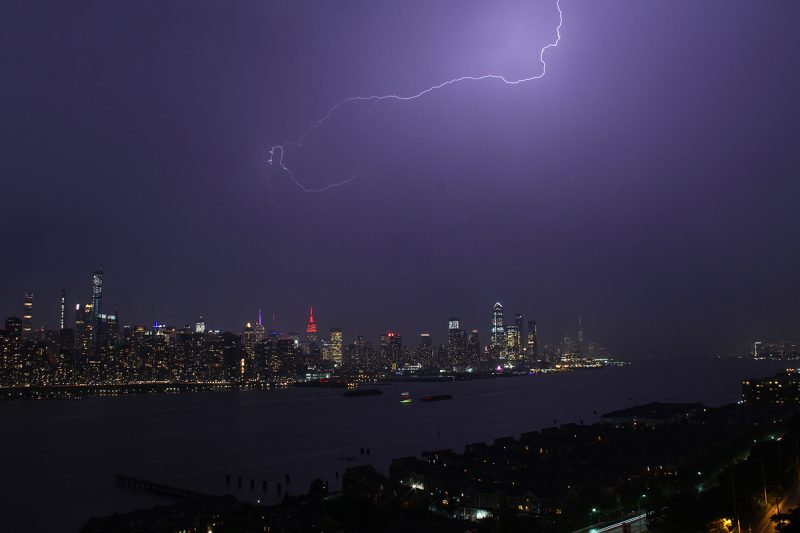
Lightning, New York City, May 28, 2019

Night lightning over NYC.

Photo by Alex Krivenyshev

Night lightning over NYC.

Photo by Alex Krivenyshev

Night lightning over NYC.

Photo by Alex Krivenyshev

Night lightning over NYC.

Photo by Alex Krivenyshev

Night lightning over NYC.

Photo by Alex Krivenyshev

Night lightning over NYC.

Photo by Alex Krivenyshev

Night lightning over NYC.

Photo by Alex Krivenyshev

Night lightning over NYC.

Photo by Alex Krivenyshev

Night lightning over NYC.

Photo by Alex Krivenyshev

Night lightning over NYC.

Photo by Alex Krivenyshev

Night lightning over NYC.

Photo by Alex Krivenyshev

Night lightning over NYC.

Photo by Alex Krivenyshev

Night lightning over NYC.

Photo by Alex Krivenyshev

Night lightning over NYC.

Photo by Alex Krivenyshev

Night lightning over NYC.

Photo by Alex Krivenyshev

Night lightning over NYC.

Photo by Alex Krivenyshev

Night lightning over NYC.

Photo by Alex Krivenyshev

Bottom line: Photos of the May 28, 2019 lightning show over New York City, by Alex Krivenshev. Visit Alex at WorldTimeZone.com or WorldTimeZone on Instagram.


from EarthSky http://bit.ly/2ws55rA
Night lightning over NYC.

Photo by Alex Krivenyshev

Night lightning over NYC.

Photo by Alex Krivenyshev

Night lightning over NYC.

Photo by Alex Krivenyshev

Night lightning over NYC.

Photo by Alex Krivenyshev

Night lightning over NYC.

Photo by Alex Krivenyshev

Night lightning over NYC.

Photo by Alex Krivenyshev

Night lightning over NYC.

Photo by Alex Krivenyshev

Night lightning over NYC.

Photo by Alex Krivenyshev

Night lightning over NYC.

Photo by Alex Krivenyshev

Night lightning over NYC.

Photo by Alex Krivenyshev

Night lightning over NYC.

Photo by Alex Krivenyshev

Night lightning over NYC.

Photo by Alex Krivenyshev

Night lightning over NYC.

Photo by Alex Krivenyshev

Night lightning over NYC.

Photo by Alex Krivenyshev

Night lightning over NYC.

Photo by Alex Krivenyshev

Night lightning over NYC.

Photo by Alex Krivenyshev

Night lightning over NYC.

Photo by Alex Krivenyshev

Bottom line: Photos of the May 28, 2019 lightning show over New York City, by Alex Krivenshev. Visit Alex at WorldTimeZone.com or WorldTimeZone on Instagram.


from EarthSky http://bit.ly/2ws55rA