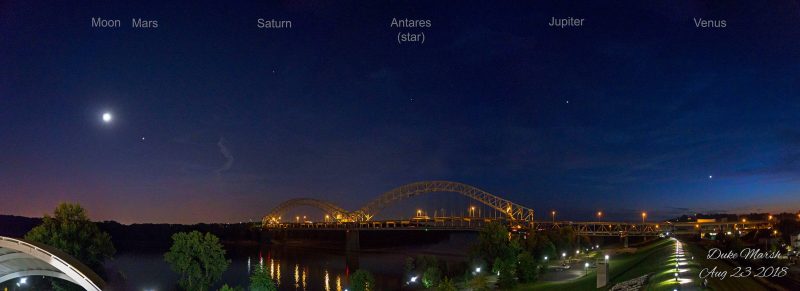
View larger. | Our friend Duke Marsh wrote on August 23, 2018: “Four of the five bright planets joined the moon above the riverfront in New Albany, Indiana. Each planet can be see directly below its name at the top. Looks best viewed full-screen on a computer monitor or large tablet.” These worlds will continue to light up the sky at nightfall throughout September, 2018.
Click the name of a planet to learn more about its visibility in September 2018: Venus, Jupiter, Saturn, Mars and Mercury
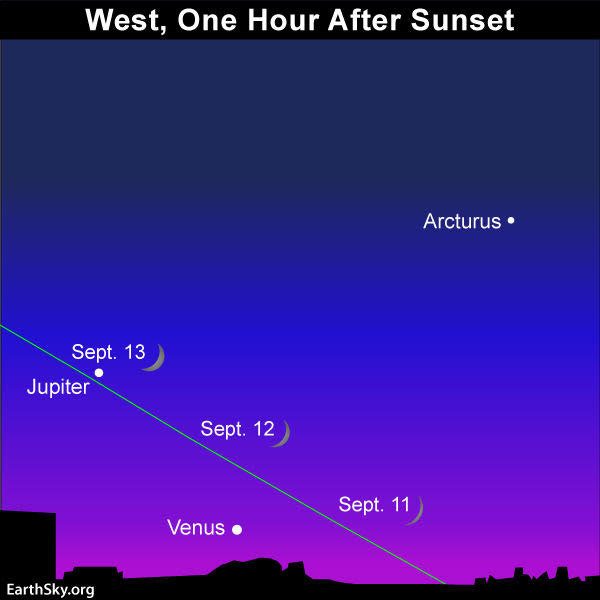
Circle September 11, 12 and 13 on your calendar, for that’s when the waxing crescent moon goses by Venus and Jupiter. Read more.
Venus is the brightest planet, and – as seen from around the world -lights up in the southwestern or western sky after sunset, and is nearly impossible to miss as the evening “star” – unless you reside at a far northerly outpost, such as Alaska or Scandinavia. That far north, Venus sets very soon after sunset.
Although Venus always ranks as the 3rd-brightest celestial object after the sun and moon, it outdoes itself in September 2018. Look for this dazzling world to shine at its brilliant best in the evening sky around the time of the September equinox.
Read more: Venus at greatest illuminated extent on September 21
At mid-northern latitudes, Venus sets roughly 1 1/2 hours after the sun in early September. By the month’s end, that’ll taper to about an hour after sunset.
What’s interesting is that – as seen from mid-northern latitudes – Venus reached its highest altitude in the evening sky after sunset in June 2018. And yet Venus’ greatest elongation (greatest apparent distance from the setting sun) happened last month, on August 17.
Why? It’s because of the shifting angle of the ecliptic, which marks the annual path of the sun, and the approximate path of the moon and planets across our sky. From our northerly latitudes, the ecliptic falls closer to the horizon and makes an increasingly shallower angle with the sunset horizon as we approach the September autumn equinox. That keeps Venus low in the sky at northerly latitudes.
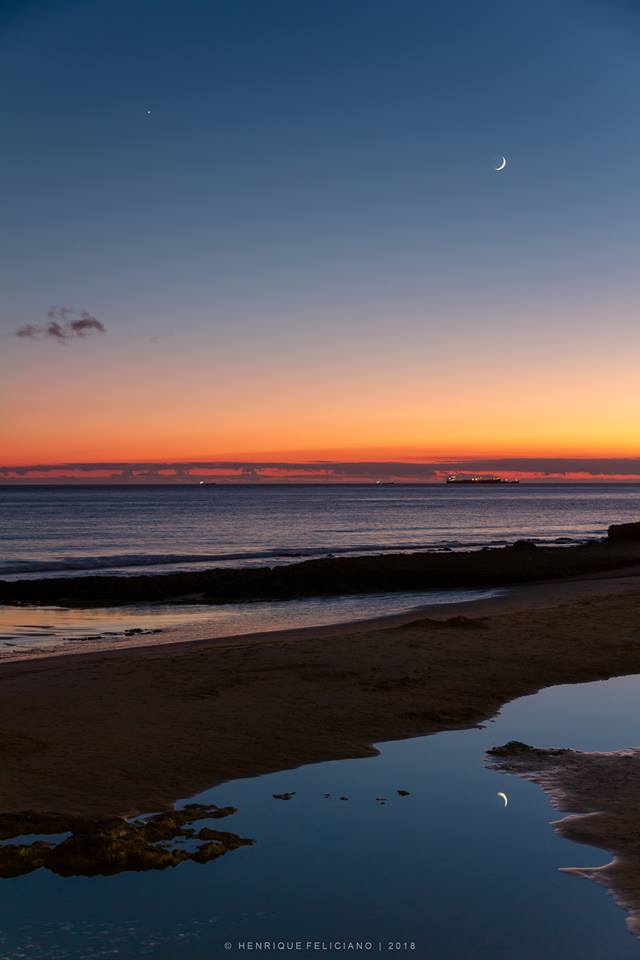
Venus, the moon – and see the moon’s reflection in Lisbon, Portugal on August 13, 2018. Photo by Henrique Feliciano Silva,
The Southern Hemisphere has the big advantage in seeing Venus because September is a late winter/early spring month in that part of the world. Therefore, day by day, the ecliptic climbs higher in the sky and intersects the sunset horizon at an increasingly steeper angle as the Southern Hemisphere approaches their September spring equinox. That places Venus high above the setting sun (rather than to the side of it as for us northerners). At temperate latitudes in the Southern Hemisphere (South Africa, southern Australia), Venus sets about 3 1/2 hours after sunset in early September and 2 1/2 hours after the sun at the month’s end.
In short, when it comes to the height of the ecliptic in the evening sky, remember the saying “spring up and fall down.” At sunset on the spring equinox, the ecliptic soars highest up for the year. At sunset on the autumn equinox, the ecliptic falls lowest down. That applies to both the Northern and Southern Hemispheres.
Circle September 11, 12 and 13 on your calendar. That’s when the young moon will be sweeping past Venus (and Jupiter) in the evening sky. The western twilight will make the pairing all the more picturesque.
From the Southern Hemisphere, look for Venus to adorn the evening sky from now till nearly the end of October 2018. At middle latitudes in the Northern Hemisphere, it’ll take a diligent effort to catch Venus after sunset in late September and early October 2018.
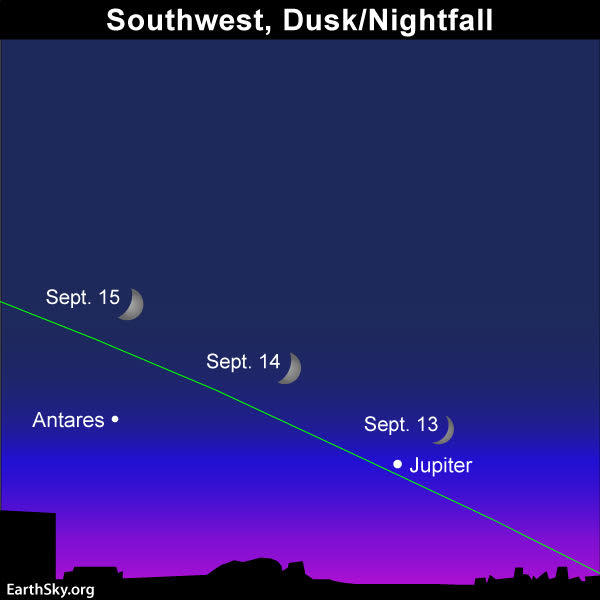
Watch for the moon to move by the planet Jupiter and the star Antares from September 13 to 15, 2018. Read more.
Jupiter remains bright and beautiful throughout September 2018. Its opposition took place on May 8-9, 2018, and ever since, the planet has been shifting westward, or in the direction of sunset. Around the world, you’ll find Jupiter highest up for the night around dusk or nightfall, appearing rather low in the southwest sky at northerly latitudes; in the Southern Hemisphere, you’ll see Jupiter quite high in the western sky.
Jupiter is brighter than any star, but it’s not brighter than Venus, which beams mightily in the west or southwest after sunset. This month, Jupiter reclaims its spot as the 4th-brightest celestial object, after the sun, moon and Venus. For some two months, from about July 7 to September 7, Mars supplanted Jupiter as the brighter of these two heavenly bodies.
Once again, as with Venus, Jupiter stays out longer after sunset in the Southern Hemisphere. That’s because the ecliptic (pathway of the sun, moon and planets) hits the evening horizon almost straight up and down in the Southern Hemisphere, yet at a shallow angle in the Northern Hemisphere.
For instance, at mid-northern latitudes (United States, mainland Europe, Japan), Jupiter sets about 3 hours after the sun in early September and about 2 hours after at the month’s end.
In contrast, at temperate latitudes in the Southern Hemisphere (Cape Town, South Africa, and southern Australia), Jupiter sets about 5 hours after the sun in early September and about 3 1/2 hours after by the month’s end.
Jupiter shines in front of the constellation Libra the Scales until November 2018. Look for Libra’s brightest stars near Jupiter, Zubenelgenubi and Zubeneschamali (both star names are pronounced with the same rhythm as Obi-Wan Kenobi of “Star Wars”).
If you aim binoculars at Zubenelgenubi, you’ll see this star as two stars. Zubeneschamali, meanwhile, is said to appear green in color, although, astronomers say, stars can’t look green.
Let the moon guide your eye to Jupiter for several evenings, centered on or around September 13.
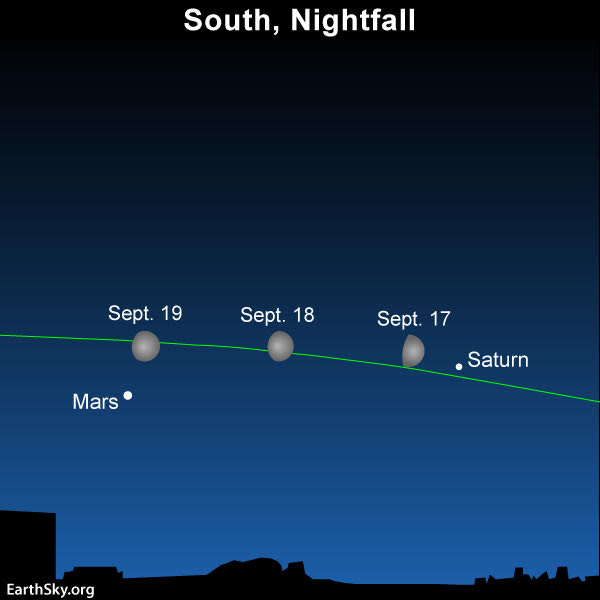
Watch for the moon to sweep by the planets Saturn and Mars from September 17 to 19. Read more.
Saturn and Mars are ideally placed for viewing around nightfall. Around the world in September, Saturn transits – reaches its highest point in the sky – around dusk or nightfall. Then Mars transits roughly two hours after Saturn does.
Click here for a recommended sky almanac providing you with the transit times for the planets.
From mid-northern latitudes, Saturn stays out until around midnight (1 a.m. daylight saving time) in early September. By the month’s end, Saturn will set around 10 p.m. (11 p.m. daylight saving time). Mars will follow Saturn beneath the western horizon roughly two hours after Saturn does.
From temperate latitudes in the Southern Hemisphere, Saturn and Mars both stay out until well after midnight.
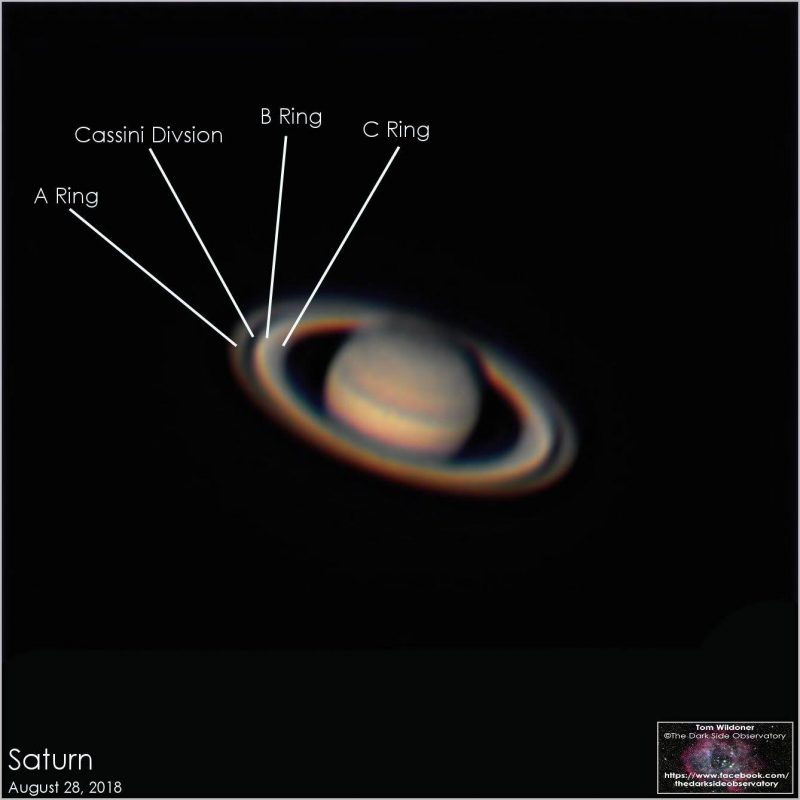
You can tell Mars from Saturn because Mars has a reddish color and Saturn looks golden. Binoculars show their colors better than the eye alone.
Watch for the moon to pair up with Saturn on or near September 17 and with Mars on or near September 19.
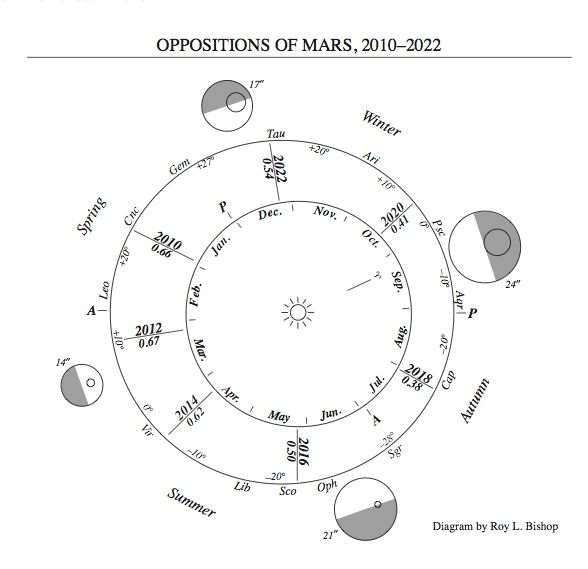
At present, both Saturn and Mars shine more brilliantly than a 1st-magnitude star. However, Mars is brighter than Saturn. Saturn’s brilliance peaked at its June 27 opposition, and Mars’ brilliance came to a head at its July 27 opposition.
It’s not often that Mars outshines Jupiter, normally the fourth-brightest celestial object to light up the sky, after the sun, moon and Venus. But, for a couple of months in 2018, Mars outshines Jupiter from about July 7 to September 7, 2018.
Both Mars and Saturn are slowly dimming throughout the month. Because Mars is dimming at a faster rate than Saturn is, Mars will be nearly 10 times brighter than Saturn at the beginning of the month, and some 5 times brighter by the month’s end.
Remember Mars’ historically close opposition of August 28, 2003? That year, it was closer and brighter than it had been in some 60,000 years. The July opposition was the best since 2003, and what’s more, Mars will remain bright and beautiful all through August 2018!
Read more: Mars brighter in 2018 than since 2003
Click here for more about close and far Mars oppositions
Mercury, the innermost planet of the solar system, might still be visible before sunrise from the Northern Hemisphere and the southern tropics in early September. But this world is rapidly falling into glare of sunrise throughout the month, and its reign as the morning “star” will officially end on September 21, 2018 (same date that Venus reaches its greatest illuminated extent in the evening sky).
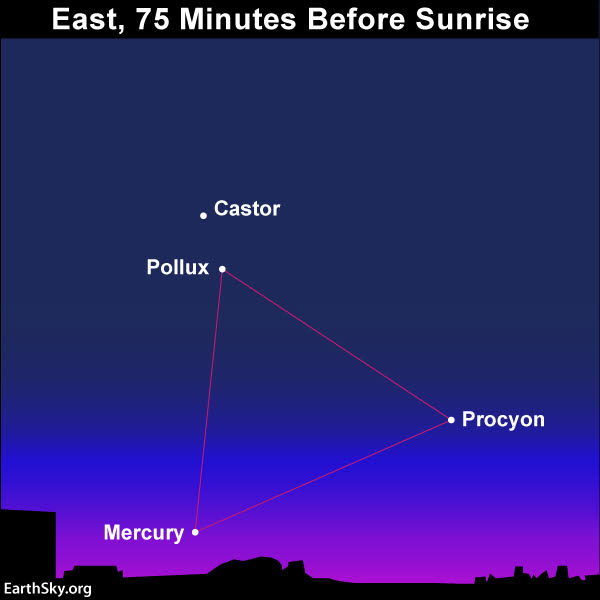
In the last week of August 2018, Mercury formed an equilateral triangle with the bright stars Pollux and Procyon. In the first week of September, Mercury will be farther away from Pollux and Procyon on the sky’s dome, making an isosceles triangle instead.
What do we mean by bright planet? By bright planet, we mean any solar system planet that is easily visible without an optical aid and that has been watched by our ancestors since time immemorial. In their outward order from the sun, the five bright planets are Mercury, Venus, Mars, Jupiter and Saturn. These planets actually do appear bright in our sky. They are typically as bright as – or brighter than – the brightest stars. Plus, these relatively nearby worlds tend to shine with a steadier light than the distant, twinkling stars. You can spot them, and come to know them as faithful friends, if you try.
Bottom line: In September 2018, four planets arc across the sky at dusk and nightfall. Venus lights up the western sky, with Jupiter shining above Venus. Mars and Saturn light up the southern sky at nightfall from northerly latitudes. From the Southern Hemisphere, Mars and Saturn shine high overhead. Click here for recommended almanacs; they can help you know when the planets rise, transit and set in your sky.
Help EarthSky keep going! Please donate what you can to our annual crowd-funding campaign.
Don’t miss anything. Subscribe to EarthSky News by email
Get your EarthSky 2018 lunar calendar now, while they last.
Visit EarthSky’s Best Places to Stargaze, and recommend a place we can all enjoy.
from EarthSky https://ift.tt/IJfHCr
View larger. | Our friend Duke Marsh wrote on August 23, 2018: “Four of the five bright planets joined the moon above the riverfront in New Albany, Indiana. Each planet can be see directly below its name at the top. Looks best viewed full-screen on a computer monitor or large tablet.” These worlds will continue to light up the sky at nightfall throughout September, 2018.
Click the name of a planet to learn more about its visibility in September 2018: Venus, Jupiter, Saturn, Mars and Mercury
Circle September 11, 12 and 13 on your calendar, for that’s when the waxing crescent moon goses by Venus and Jupiter. Read more.
Venus is the brightest planet, and – as seen from around the world -lights up in the southwestern or western sky after sunset, and is nearly impossible to miss as the evening “star” – unless you reside at a far northerly outpost, such as Alaska or Scandinavia. That far north, Venus sets very soon after sunset.
Although Venus always ranks as the 3rd-brightest celestial object after the sun and moon, it outdoes itself in September 2018. Look for this dazzling world to shine at its brilliant best in the evening sky around the time of the September equinox.
Read more: Venus at greatest illuminated extent on September 21
At mid-northern latitudes, Venus sets roughly 1 1/2 hours after the sun in early September. By the month’s end, that’ll taper to about an hour after sunset.
What’s interesting is that – as seen from mid-northern latitudes – Venus reached its highest altitude in the evening sky after sunset in June 2018. And yet Venus’ greatest elongation (greatest apparent distance from the setting sun) happened last month, on August 17.
Why? It’s because of the shifting angle of the ecliptic, which marks the annual path of the sun, and the approximate path of the moon and planets across our sky. From our northerly latitudes, the ecliptic falls closer to the horizon and makes an increasingly shallower angle with the sunset horizon as we approach the September autumn equinox. That keeps Venus low in the sky at northerly latitudes.
Venus, the moon – and see the moon’s reflection in Lisbon, Portugal on August 13, 2018. Photo by Henrique Feliciano Silva,
The Southern Hemisphere has the big advantage in seeing Venus because September is a late winter/early spring month in that part of the world. Therefore, day by day, the ecliptic climbs higher in the sky and intersects the sunset horizon at an increasingly steeper angle as the Southern Hemisphere approaches their September spring equinox. That places Venus high above the setting sun (rather than to the side of it as for us northerners). At temperate latitudes in the Southern Hemisphere (South Africa, southern Australia), Venus sets about 3 1/2 hours after sunset in early September and 2 1/2 hours after the sun at the month’s end.
In short, when it comes to the height of the ecliptic in the evening sky, remember the saying “spring up and fall down.” At sunset on the spring equinox, the ecliptic soars highest up for the year. At sunset on the autumn equinox, the ecliptic falls lowest down. That applies to both the Northern and Southern Hemispheres.
Circle September 11, 12 and 13 on your calendar. That’s when the young moon will be sweeping past Venus (and Jupiter) in the evening sky. The western twilight will make the pairing all the more picturesque.
From the Southern Hemisphere, look for Venus to adorn the evening sky from now till nearly the end of October 2018. At middle latitudes in the Northern Hemisphere, it’ll take a diligent effort to catch Venus after sunset in late September and early October 2018.
Watch for the moon to move by the planet Jupiter and the star Antares from September 13 to 15, 2018. Read more.
Jupiter remains bright and beautiful throughout September 2018. Its opposition took place on May 8-9, 2018, and ever since, the planet has been shifting westward, or in the direction of sunset. Around the world, you’ll find Jupiter highest up for the night around dusk or nightfall, appearing rather low in the southwest sky at northerly latitudes; in the Southern Hemisphere, you’ll see Jupiter quite high in the western sky.
Jupiter is brighter than any star, but it’s not brighter than Venus, which beams mightily in the west or southwest after sunset. This month, Jupiter reclaims its spot as the 4th-brightest celestial object, after the sun, moon and Venus. For some two months, from about July 7 to September 7, Mars supplanted Jupiter as the brighter of these two heavenly bodies.
Once again, as with Venus, Jupiter stays out longer after sunset in the Southern Hemisphere. That’s because the ecliptic (pathway of the sun, moon and planets) hits the evening horizon almost straight up and down in the Southern Hemisphere, yet at a shallow angle in the Northern Hemisphere.
For instance, at mid-northern latitudes (United States, mainland Europe, Japan), Jupiter sets about 3 hours after the sun in early September and about 2 hours after at the month’s end.
In contrast, at temperate latitudes in the Southern Hemisphere (Cape Town, South Africa, and southern Australia), Jupiter sets about 5 hours after the sun in early September and about 3 1/2 hours after by the month’s end.
Jupiter shines in front of the constellation Libra the Scales until November 2018. Look for Libra’s brightest stars near Jupiter, Zubenelgenubi and Zubeneschamali (both star names are pronounced with the same rhythm as Obi-Wan Kenobi of “Star Wars”).
If you aim binoculars at Zubenelgenubi, you’ll see this star as two stars. Zubeneschamali, meanwhile, is said to appear green in color, although, astronomers say, stars can’t look green.
Let the moon guide your eye to Jupiter for several evenings, centered on or around September 13.
Watch for the moon to sweep by the planets Saturn and Mars from September 17 to 19. Read more.
Saturn and Mars are ideally placed for viewing around nightfall. Around the world in September, Saturn transits – reaches its highest point in the sky – around dusk or nightfall. Then Mars transits roughly two hours after Saturn does.
Click here for a recommended sky almanac providing you with the transit times for the planets.
From mid-northern latitudes, Saturn stays out until around midnight (1 a.m. daylight saving time) in early September. By the month’s end, Saturn will set around 10 p.m. (11 p.m. daylight saving time). Mars will follow Saturn beneath the western horizon roughly two hours after Saturn does.
From temperate latitudes in the Southern Hemisphere, Saturn and Mars both stay out until well after midnight.
You can tell Mars from Saturn because Mars has a reddish color and Saturn looks golden. Binoculars show their colors better than the eye alone.
Watch for the moon to pair up with Saturn on or near September 17 and with Mars on or near September 19.
At present, both Saturn and Mars shine more brilliantly than a 1st-magnitude star. However, Mars is brighter than Saturn. Saturn’s brilliance peaked at its June 27 opposition, and Mars’ brilliance came to a head at its July 27 opposition.
It’s not often that Mars outshines Jupiter, normally the fourth-brightest celestial object to light up the sky, after the sun, moon and Venus. But, for a couple of months in 2018, Mars outshines Jupiter from about July 7 to September 7, 2018.
Both Mars and Saturn are slowly dimming throughout the month. Because Mars is dimming at a faster rate than Saturn is, Mars will be nearly 10 times brighter than Saturn at the beginning of the month, and some 5 times brighter by the month’s end.
Remember Mars’ historically close opposition of August 28, 2003? That year, it was closer and brighter than it had been in some 60,000 years. The July opposition was the best since 2003, and what’s more, Mars will remain bright and beautiful all through August 2018!
Read more: Mars brighter in 2018 than since 2003
Click here for more about close and far Mars oppositions
Mercury, the innermost planet of the solar system, might still be visible before sunrise from the Northern Hemisphere and the southern tropics in early September. But this world is rapidly falling into glare of sunrise throughout the month, and its reign as the morning “star” will officially end on September 21, 2018 (same date that Venus reaches its greatest illuminated extent in the evening sky).
In the last week of August 2018, Mercury formed an equilateral triangle with the bright stars Pollux and Procyon. In the first week of September, Mercury will be farther away from Pollux and Procyon on the sky’s dome, making an isosceles triangle instead.
What do we mean by bright planet? By bright planet, we mean any solar system planet that is easily visible without an optical aid and that has been watched by our ancestors since time immemorial. In their outward order from the sun, the five bright planets are Mercury, Venus, Mars, Jupiter and Saturn. These planets actually do appear bright in our sky. They are typically as bright as – or brighter than – the brightest stars. Plus, these relatively nearby worlds tend to shine with a steadier light than the distant, twinkling stars. You can spot them, and come to know them as faithful friends, if you try.
Bottom line: In September 2018, four planets arc across the sky at dusk and nightfall. Venus lights up the western sky, with Jupiter shining above Venus. Mars and Saturn light up the southern sky at nightfall from northerly latitudes. From the Southern Hemisphere, Mars and Saturn shine high overhead. Click here for recommended almanacs; they can help you know when the planets rise, transit and set in your sky.
Help EarthSky keep going! Please donate what you can to our annual crowd-funding campaign.
Don’t miss anything. Subscribe to EarthSky News by email
Get your EarthSky 2018 lunar calendar now, while they last.
Visit EarthSky’s Best Places to Stargaze, and recommend a place we can all enjoy.
from EarthSky https://ift.tt/IJfHCr