Physics of a glacial 'slushy' reveal granular forces on a massive scale

The ridge in the right center of the photo shows where icebergs have broken off from Jakobshavn Glacier and tumbled into the water to form a slushy ice mélange — the world's largest granular material. Photo by Ryan Cassotto.

By Carol Clark

The laws for how granular materials flow apply even at the giant, geophysical scale of icebergs piling up in the ocean at the outlet of a glacier, scientists have shown.

The Proceedings of the National Academy of Sciences (PNAS) published the findings, describing the dynamics of the clog of icebergs — known as an ice mélange — in front of Greenland’s Jakobshavn Glacier. The fast-moving glacier is considered a bellwether for the effects of climate change.

“We’ve connected microscopic theories for the mechanics of granular flowing with the world’s largest granular material — a glacial ice mélange,” says Justin Burton, a physicist at Emory University and lead author of the paper. “Our results could help researchers who are trying to understand the future evolution of the Greenland and Antarctica ice sheets. We’ve showed that an ice mélange could potentially have a large and measurable effect on the production of large icebergs by a glacier.”

The National Science Foundation funded the research, which brought together physicists who study the fundamental mechanics of granular materials in laboratories and glaciologists who spend their summers exploring polar ice sheets.

“Glaciologists generally deal with slow, steady deformation of glacial ice, which behaves like thick molasses — a viscous material creeping towards the sea,” says co-author Jason Amundson, a glaciologist at the University of Alaska Southeast, Juneau. “Ice mélange, on the other hand, is fundamentally a granular material — essentially a giant slushy — that is governed by different physics. We wanted to understand the behavior of ice mélange and its effects on glaciers.”


For thousands of years, the massive glaciers of Earth’s polar regions have remained relatively stable, the ice locked into mountainous shapes that ebbed in warmer months but gained back their bulk in winter. In recent decades, however, warmer temperatures have started rapidly thawing these frozen giants. It’s becoming more common for sheets of ice — some one kilometer tall — to shift, crack and tumble into the sea, splitting from their mother glaciers in an explosive process known as calving.

Jakobshavn Glacier is advancing as fast as 50 meters per day until it reaches the ocean edge, a point known as the glacier terminus. About 35 billion tons of icebergs calve off of Jakobshavn Glacier each year, spilling out into Greenland’s Ilulissat fjord, a rocky channel that is about five kilometers wide. The calving process creates a tumbling mix of icebergs which are slowly pushed through the fjord by the motion of the glacier. The ice mélange can extend hundreds of meters deep into the water but on the surface it resembles a lumpy field of snow which inhibits, but cannot stop, the motion of the glacier.

“An ice mélange is kind of like purgatory for icebergs, because they’ve broken off into the water but they haven’t yet made it out to open ocean,” Burton says.

While scientists have long studied how ice forms, breaks and flows within a glacier, no one had quantified the granular flow of an ice mélange. It was an irresistible challenge to Burton. His lab creates experimental models of glacial processes to try to quantify their physical forces. It also uses microscopic particles as a model to understand the fundamental mechanics of granular, amorphous materials, and the boundary between a free-flowing state and a rigid, jammed-up one.

“Granular material is everywhere, from the powders that make up pharmaceuticals to the sand, dirt and rocks that shape our Earth,” Burton says. And yet, he adds, the properties of these amorphous materials are not as well understood as those of liquids or crystals.

In addition to Amundson, Burton’s co-authors on the PNAS paper include glaciologist Ryan Cassotto — formerly with the University of New Hampshire and now with the University of Colorado Boulder — and physicists Chin-Chang Kuo and Michael Dennin, from the University of California, Irvine.

The researchers characterized both the flow and mechanical stress of the Jacobshavn ice mélange using field measurements, satellite data, lab experiments and numerical modeling. The results quantitatively describe the flow of the ice mélange as it jams and unjams during its journey through the fjord.

The paper also showed how the ice mélange can act as a “granular ice shelf” in its jammed state, buttressing even the largest icebergs calved into the ocean.

“We’ve shown that glaciologists modeling the behavior of ice shelves with ice mélanges should factor in the forces of those mélanges,” Burton says. “We’ve provided them with the quantitative tools to do so.”

Related:
The physics of a glacial earthquake
How lifeless particles can become 'life-like' by switching behaviors

from eScienceCommons https://ift.tt/2rdhgVY

May guide to the bright planets

The waxing gibbous moon travels away from the star Spica and toward the dazzling planet Jupiter on the nights of April 28, 29 and 30, 2018.

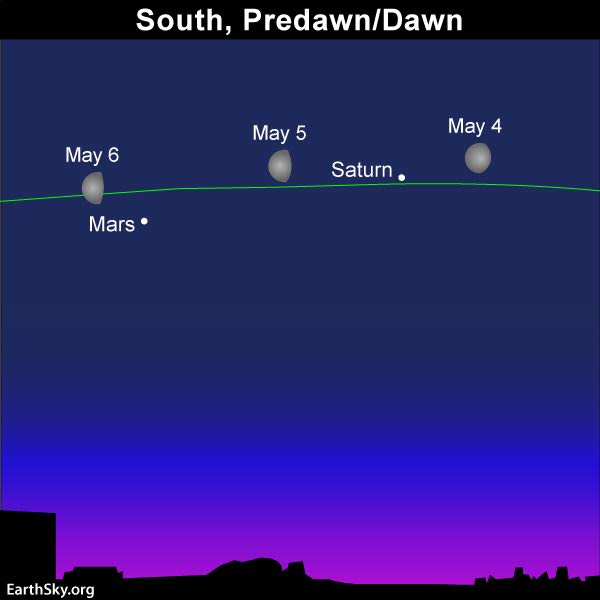
The moon couples up with Saturn in the morning sky on May 4 and Mars on May 6. Read more.

Follow the links below to learn more about the planets in May 2018:

Mars and Saturn, Jupiter, Venus, Mercury

Mars and Saturn rise into the southeast sky quite late at night throughout May (especially as viewed from the Northern Hemisphere). Your best view of them is in the predawn hours, when these planets appear much higher up in the sky. You can tell Mars from Saturn because Mars has a reddish color. Saturn looks golden. Binoculars show their colors better than the eye alone.

Mars and Saturn shine in front of Sagittarius, the constellation marking the direction to our galaxy’s center. Use the moon to locate Mars and Saturn on the mornings of May 4, 5 and 6. As the month progresses, Mars travels farther and farther east of Saturn on the sky’s dome, to move out of the constellation Sagittarius and into the constellation Capricornus by mid-May 2018. Saturn, in the meantime, stays in front of the constellation Sagittarius for a few more years.

At present, both Mars and Saturn shine as brilliantly as 1st-magnitude stars. However, Mars is brighter than Saturn. Saturn’s brilliance will increase until it peaks at its June 27 opposition, and Mars’ brilliance will also increase until it peaks at its July 27 opposition.

But Saturn’s brightness increase will be subtle, while Mars’ will be dramatic! It’s not often that Mars outshines Jupiter, normally the fourth-brightest celestial object to light up the sky. The three brightest celestial bodies are the sun, moon and Venus. But Mars will actually become the fourth-brightest for a couple of months in 2018, centered on Mars’ July 27 opposition. Remember Mars’ historically close opposition of August 28, 2003? That year, it was closer and brighter than it had been in some 60,000 years. This upcoming July opposition will be the best since then.

In early May, at mid-northern latitudes (U.S., Europe, Japan), Saturn rises about 11 p.m. local time (12 midnight local daylight-saving time) and Mars follows Saturn into the sky roughly an hour later. By the month’s end, Saturn comes up just after nightfall (about when Venus sets) whereas Mars doesn’t climb above the horizon until roughly 11 p.m. local time (12 midnight local daylight-saving time).

As for temperate latitudes in the Southern Hemisphere (South Africa, southern Australia, New Zealand), Saturn rises around 9 p.m. local time and Mars about an hour later, around 10 p.m. local time. By the end of the month, Saturn rises around 8 p.m (about when Venus sets) and Mars comes up about 10 p.m.local time.

Click here for a sky almanac

Read more: Mars brighter in 2018 than since 2003

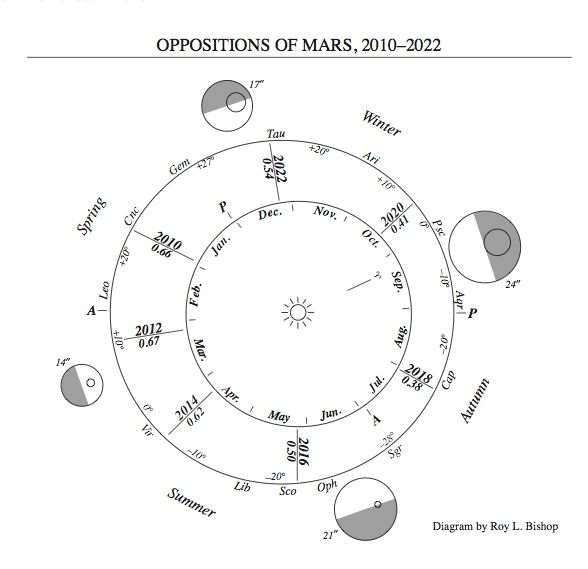
Click here for more about close and far Mars oppositions

Diagram by Roy L. Bishop. Copyright Royal Astronomical Society of Canada. Used with permission. Visit the RASC estore to purchase the Observers Handbook, a necessary tool for all skywatchers.

Diagram by Roy L. Bishop. Copyright Royal Astronomical Society of Canada. Used with permission. Visit the RASC estore to purchase the Observers Handbook, a necessary tool for all skywatchers. Read more about this image.

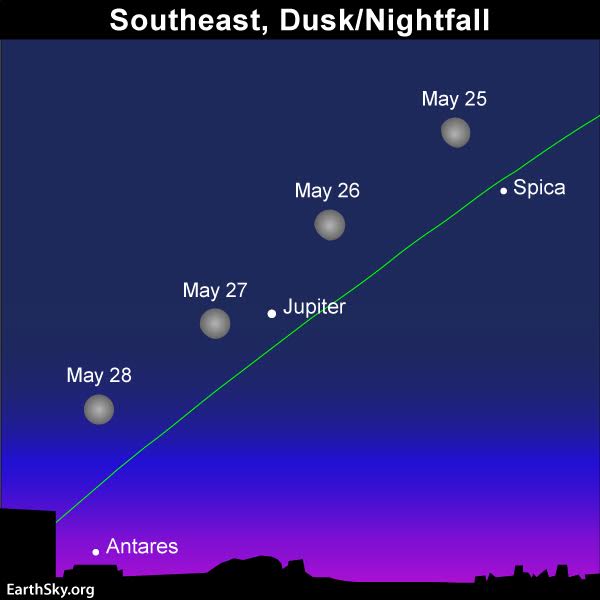
The green line depicts the ecliptic – the pathway of the sun, moon and planets in front of the constellations of the zodiac. Let the moon guide your eye to the stars Spica and Antares, and the planet Jupiter, on May 25, 26, 27 and 28. Read more.

Jupiter enjoys its moment of glory as it reaches opposition on the night of May 8-9, 2018. In May 2018, Jupiter ranks as the fourth-brightest sky object, after the sun, moon and Venus. Look southeast at nightfall or early evening, and if you see a starlike object near the horizon that’s brighter than any star, that’s probably Jupiter. Late in the month, let the moon guide your eye to Jupiter on the evenings of May 25,26, 27 and 28.

In early May, at mid-northern latitudes (U.S., Europe, Japan), Jupiter comes up at roughly 10 p.m. (11 p.m. daylight saving time) local time. At temperate latitudes in the Southern Hemisphere (South Africa, southern Australia and New Zealand), Jupiter is up around 9 p.m. local time in early April. After Jupiter rises, it’s out for the rest of the night.

Around its opposition on on the night of May 8-9, 2018 – when Earth flies between Jupiter and the sun, gaining a lap on the planet for this year – Jupiter will be rising in the east as the sun sets in the west, to beam all night, from dusk until dawn.

It’ll be fun to watch Jupiter and Venus in May. Early in the month, at nightfall and early evening, look for Venus to blaze away in the west at the same time that Jupiter lights up the eastern sky. By the month’s end, you should easily see the sky’s two brightest planets – Venus in the west, and Jupiter in the east – at evening dusk.

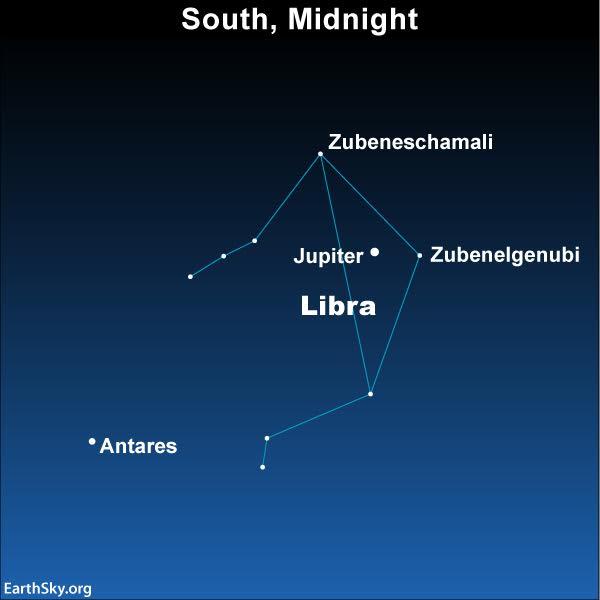
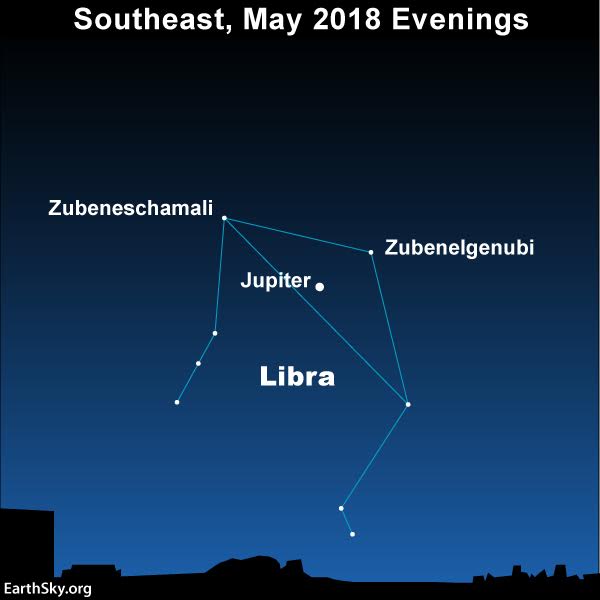
In 2018, the planet Jupiter acts as your guide “star” to the constellation Libra.

Jupiter shines in front of the constellation Libra the Scales until November 2018 (see sky chart above). Look for Libra’s brightest stars near Jupiter, Zubenelgenubi and Zubeneschamali (both star names are pronounced with the same rhythm as Obi-Wan Kenobi, of Star Wars). If you aim binoculars at Zubenelgenubi, you’ll see this star as two stars. Zubeneschamali, meanwhile, is said to appear green in color, although, astronomers say, stars can’t look green.

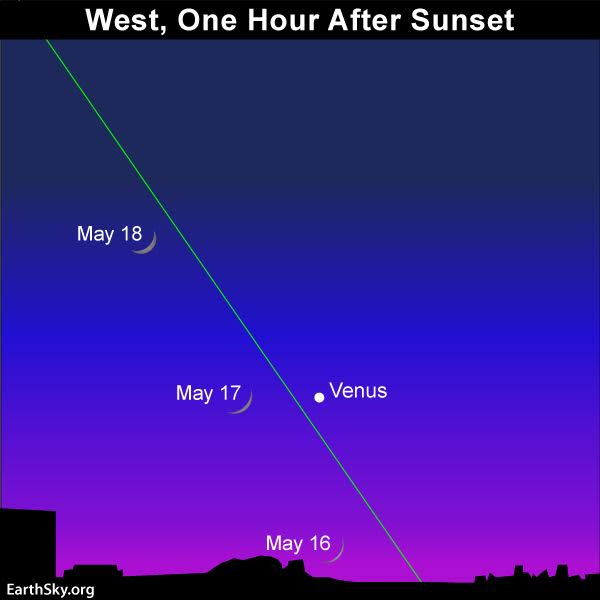
The young waxing crescent moon swings by the planet Venus on May 16, 17 and 18. Read more.

Venus is the brightest planet. Throughout May, Venus appears as a dazzling evening “star,” found in the west after sunset. This month, the planet is still climbing upward from the sunset point. Each evening in May, it stays out longer after the sun sets. Look for Venus to adorn the western evening sky until October 2018.

Circle May 17 on your calendar. That’s when the young moon swings close to Venus for a picturesque pairing in the western twilight (see the sky chart above).

At mid-northern latitudes (U.S., Europe, Japan), Venus sets about two hours after the sun at the beginning of May, and by the month’s end, sets about 2 1/2 hours after sunset. From temperate latitudes in the Southern Hemisphere (South Africa, southern Australia, New Zealand), Venus sets about 1 1/2 hours after the sun in early May, and by the month’s end, sets about 2 1/2 hours after sunset. Click here for recommended sky almanacs; they can give you Venus’ setting time in your sky.

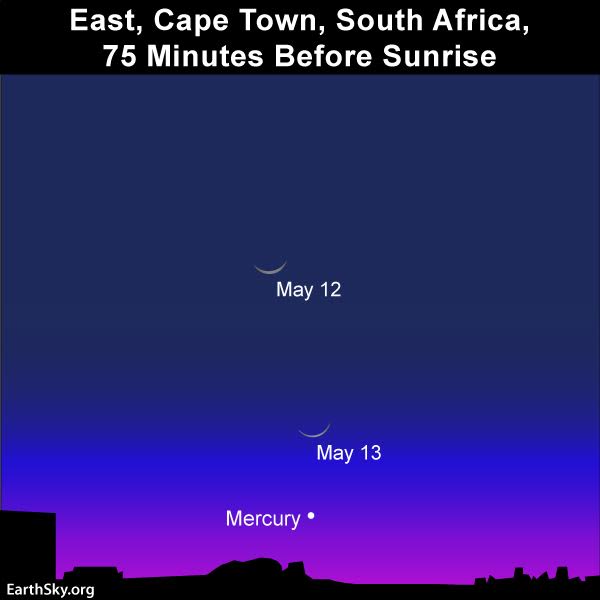
From southerly latitudes, the waning crescent moon helps to guide your eye to the planet Mercury on April 13 and 14. Read more.

Mercury, the innermost planet of the solar system, remains a fixture of the morning sky throughout May 2018, though the first half of the month offers better viewing. The present morning apparition of Mercury in April and May 2018 is the best of the year for the Southern Hemisphere, but poorest of the year for the Northern Hemisphere.

Mercury reached its greatest western elongation from the sun on April 29, 2018. At temperate latitudes in the Southern Hemisphere (South Africa, southern Australia, New Zealand), Mercury rises more than two hours before the sun during the first week of May. But at mid-northern latitudes (United States, Europe, Japan), Mercury struggles to climb over the horizon even as much as one hour before sunrise in early May.

What do we mean by bright planet? By bright planet, we mean any solar system planet that is easily visible without an optical aid and that has been watched by our ancestors since time immemorial. In their outward order from the sun, the five bright planets are Mercury, Venus, Mars, Jupiter and Saturn. These planets actually do appear bright in our sky. They are typically as bright as – or brighter than – the brightest stars. Plus, these relatively nearby worlds tend to shine with a steadier light than the distant, twinkling stars. You can spot them, and come to know them as faithful friends, if you try.

Bottom line: In May 2018, Venus appears in the west in evening twilight, Jupiter rises at early-to-mid evening and is low in the southwest by dawn. Mars and Saturn rise late at night but are well placed in the predawn/dawn sky. Mercury makes an appearance in the east before sunrise in the first half of April (at southerly latitudes). Click here for recommended almanacs; they can help you know when the planets rise, transit and set in your sky.

Don’t miss anything. Subscribe to EarthSky News by email

Enjoy knowing where to look in the night sky? Please donate to help EarthSky keep going.

Get your EarthSky 2018 lunar calendar now, while they last.

Visit EarthSk’s Best Places to Stargaze, and recommend a place we can all enjoy.


from EarthSky https://ift.tt/IJfHCr

Mapping Tool Scores Sites for Watershed Protection


by Tom Damm

Ralph Spagnolo and Ellen Bryson know their way around the state capitals in EPA’s Mid-Atlantic Region.  The regional Water Protection Division employees have been on the road helping states launch an innovative online mapping tool that prioritizes sites for watershed preservation or restoration.

They will be in Dover, Delaware this week to debut the Watershed Resources Registry for state employees and others.  In past months, they’ve led registry launches in other states in the region, and when Virginia unveils its version of the tool, it will be a clean sweep in the Mid-Atlantic.

What’s all the fuss about?

 Volumes of data and information are entered by federal, state and local agencies and non-profit groups into a user-friendly Geographic Information System (GIS).  The GIS tool scores sites from one to five stars and lets decision-makers zero in on the best areas for protecting and restoring watershed lands and improving stormwater management.

The data fed into the system ranges from soil type, land cover and flood plains to impaired and high-quality streams, protected lands and wetlands inventories.  The tool allows users to identify locations, assess and compare potential projects and their environmental impacts, print site maps for field visits, and share information.  It also helps to streamline the permitting process and provide transparency in site selection.

The registry is especially useful for developers, natural resource and transportation planners and others who are required to avoid impacting natural areas or to provide mitigation for any unavoidable impacts.

In February, an updated registry was made available to the public.  Check it out and see how teams of partners are working to protect watershed lands.


About the Author: Tom Damm has been with EPA since 2002 and now serves as communications coordinator for the region’s Water Protection Division.


from The EPA Blog https://ift.tt/2jkyMEq

Moon and Jupiter meet in Libra

When night falls in the western hemisphere on April 30, 2018, the moon is about a day past full, but – from the whole Earth – it’ll still look bright and full in our sky. The April 30 moon is near the dazzling planet Jupiter, which – after the sun, moon and Venus – is the fourth-brightest celestial body to light up the heavens. Venus sets in the west at early evening, leaving the very bright moon and very bright Jupiter to rule the night. Also look for Spica, Virgo’s brightest star, above the moon and Jupiter in early evening.

Jupiter is now near its May 9 opposition, when Earth will fly between this outer planet and the sun. As seen from around the globe, Jupiter will be a very prominent sight in our eastern skies after sundown for the coming month. It’ll remain prominent through May and into June.

This is an awesome time to look at Jupiter with a telescope or binoculars. Learn to see Jupiter’s moons.

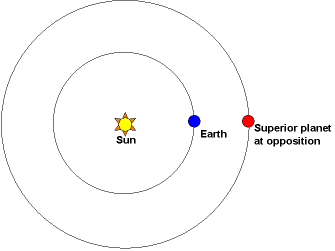
Opposition happens when Earth flies between an outer planet, like Jupiter, and the sun. This happens yearly for most of the outer planets (except Mars). Illustration via Heavens Above.

City or country – moon or no moon – Jupiter is easily visible, and we’re now in the middle of the best time of year to see it. It’s now rising in the east as Venus is setting in the west … stand outside at nightfall, and see if you can catch the two planets at the same time, Jupiter ascending in the east and Venus sinking behind the sunset.

Jupiter takes about 12 years to orbit the sun, and there are 12 constellations of the zodiac. So – traveling once around our sky every 12 years – Jupiter stays in any one zodiacal constellation for roughly a year. In 2018, it’s Libra’s turn. Use the moon to find Jupiter on April 30, then use Jupiter to find Libra for months to come.

Jupiter is now fairly close to Libra’s two brightest stars, Zubenelgenubi and Zubeneschamali, on the great dome of sky. Use Jupiter to more easily find these two modestly bright stars when the moon moves out of the evening sky in another few days.

You can’t miss Jupiter, but these Libra stars – without Jupiter – are a bit harder to locate. The chart below shows you how to find them in relationship to Jupiter:

Let Jupiter act as your guide “star” to the constellation Libra the Scales for many months to come!

How many of you have birthdays between October 31 and November 23? We ask because the sun shines in front of Libra at that time of year. This year, in 2018, the sun enters the constellation Libra on October 31 at 7 UTC and leaves Libra on November 23 at 12 UTC. Of course, this constellation is lost in the sun’s glare at that time of year, so you won’t be able to see Libra then.

The months of April and May are always better for viewing Libra than October or November. Find it now, and enjoy!

Bottom line: On April 30, 2018, enjoy the bright moon near Jupiter.


from EarthSky https://ift.tt/2r8wJHJ

New Shepard has successful 8th test flight

Blue Origin’s suborbital rocket ship – New Shepard – flew again for the 8th time this weekend (April 29, 2018), launching from Blue Origin’s West Texas Launch Site. Known as Mission 8 (M8), the mission featured a reflight of the vehicle flown on Mission 7. For the second time, Blue Origin’s test dummy Mannequin Skywalker flew to space. In an email sent last night, Blue Origin said the test dummy was:

… conducting astronaut telemetry and science studies.

The Crew Capsule reached an apogee – greatest distance from Earth – of 351,000 feet (66 miles, 107 km) – the altitude we’ve been targeting for operations.

We look forward to sharing upcoming test flights as we continue our progress toward human spaceflight.

Blue Origin was started in 2000 by Amazon’s founder, billionaire Jeff Bezos. Space tourism is one Blue Origin’s business goals. Like Elon Musk and SpaceX, Bezos wants to change commercial spaceflight by developing reusable rockets to bring costs down. The company’s motto is Gradatim Ferociter! That’s Latin for:

Step by Step, Ferociously.

The April 29 test flight also carried research payloads for NASA, the German Aerospace Center (DLR), and commercial customers. Learn more about the payloads at Blue Origins’ blog.

A replay of the livestream from Sunday’s test flight is below:

Before the test flight, the Blue Origin team gathered in West Texas. Image via Blue Origin.

Blue Origin’s Mannequin Skywalker on its 1st test flight in December 2017. The test dummy flew again on April 29, 2018. Image via Blue Origin.

Bottom line: Blue Origin’s suborbital rocket New Shepard made its 8th test flight on April 29, 2018, launching from Blue Origin’s West Texas Launch Site.


from EarthSky https://ift.tt/2ji7QoU

2018 SkS Weekly Climate Change & Global Warming Digest #17

Story of the Week... Toon of the Week... Quote of the Week... Graphic of the Week... SkS in the News... Photo of the Week... Coming Soon on SkS... Poster of the Week... Climate Feedback Reviews... SkS Week in Review... 97 Hours of Consensus...

Story of the Week...

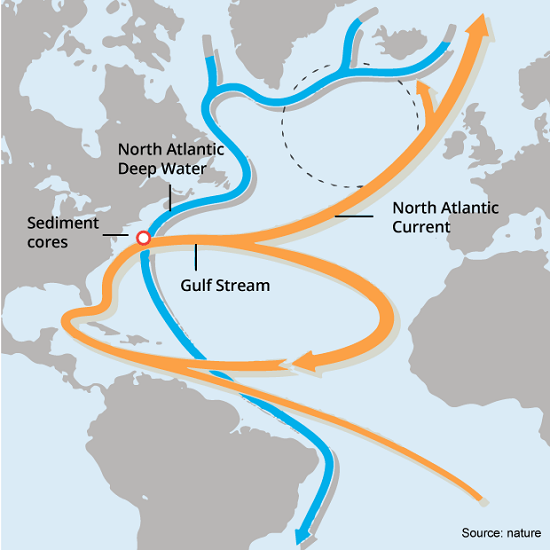
Gulf Stream slowing down is bad news for Ireland

Map of Gulf Stream near Ireland

Ireland lies relatively far north in the Atlantic so the Gulf Stream’s gift of more temperate waters matters hugely to our climate.

All Ireland is washed by the Gulf Stream,” said Stephen Dedalus in the opening chapter of Ulysses. He might have added warmed to washed.

Ireland lies relatively far north in the Atlantic so the Gulf Stream’s gift of more temperate waters matters hugely to our climate, as does their interaction with the atmosphere to produce the sea surface temperature. This oceanic movement of waters is known scientifically as the Atlantic Meridional Overturning Circulation (Amoc). It brings warm and salty water from the Caribbean region in a northeasterly current towards the Nordic Seas.

As Summer K Praetorius goes on to explain in the April 11th issue of the scientific journal Nature: “In the chill of winter, these waters cool and descend with the heavy load of their salinity. This deep convection is a key part of the Amoc which can be thought of as an ocean conveyor belt that releases heat to the atmosphere above the North Atlantic Ocean before travelling through the abyssal ocean to resurface in other areas of the world.” The process is linked to and replicated throughout the world’s oceans by the deep colder waters that travel past North and South America.

Gulf Stream slowing down is bad news for Ireland by Paul Gillespie, Irish Times, Apr 28, 2018 

Note: Also see Graphic of the Week section of this Digest.


Toon of the Week...

2018 Toon 17 


Quote of the Week...

But the problem with the way geoengineering is discussed today, lamented John Ehrenfeld, former director of the MIT Program on Technology, Business, and Environment, is that it doesn’t address the societal issues that got us in this mess in the first place.

“It’s a failure to accept complexity of the system, and the system includes people,” Ehrenfeld told me recently over coffee. For decades, Ehrenfeld, who is now retired, researched and promoted the concept of sustainability. But to Ehrenfeld, after all the climate conferences, all the stakeholder roundtables, all the debates on market-driven solutions, the questions and answers being debated never questioned capitalism, civilization, and the notion of progress.

Tackling a problem as deeply ingrained as global warming, Ehrenfeld said, will require humanity to face an existential question that geoengineering alone cannot address: Are we willing to sacrifice growth to ensure the survival of our species?

“Absent decoupling growth from progress,” Ehrenfeld said, “we won’t address the core of the problem.”

The Dangerous Belief That Extreme Technology Will Fix Climate Change by Aleszu Bajak, Huff Post, Apr 27, 2018


Graphic of the Week...

Atlantic Meridional Overturning Circulation (AMOC) 

Gulf Stream slowing down is bad news for Ireland by Paul Gillespie, Irish Times, Apr 28, 2018 


SkS in the News...

The SkS Escalator graphic is embedded and extensively referenced in in Matt Rogers' Washington Post article, Global temperatures have dropped since 2016. Here’s why that’s normal


Photo of the Week...

 Flooding on Hawaiian Island of Kauai March 2018

Floodwaters on the Hawaiian island of Kauai turned orange, a sign of the high iron content in the volcanic soil. (Brandon Verdura / Associated Press) 

A Hawaiian island got about 50 inches of rain in 24 hours. Scientists warn it's a sign of the future by Heidi Chang, Los Angeles Times, Apr 28, 2018 


SkS Spotlights...

CPLC Logo

The Carbon Pricing Leadership Coalition (CPLC) brings together leaders from government, private sector, academia, and civil society to expand the use of carbon pricing policies. 


Coming Soon on SkS...

  • Republicans have so corrupted EPA, Americans can only fix it in the voting booth (Dana)
  • TV Meteorologists Warming to Climate Science (greenman)
  • Guest Post (John Abraham)
  • SkS Analogy 11 - Frame of Reference (Evan Whitby)
  • New research this week (Ari)
  • 2017 SkS Weekly Climate Change & Global Warming News Roundup #18 (John Hartz)
  • 2017 SkS Weekly Climate Change & Global Waming Digest #18 (John Hartz)

Poster of the Week...

2018 Poster 17 


Climate Feedback Reviews...

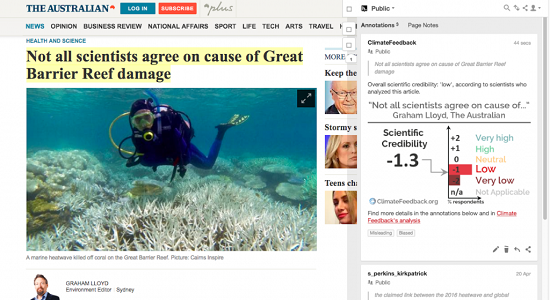
The Australian’s coverage of Great Barrier Reef study creates perception that scientists are divided

2018 Climate Feedback 17 

Climate Feedback asked its network of scientists to review the article, Not all scientists agree on cause of Great Barrier Reef damage  by Graham Lloyd, Health & Science, The Australian, April 19, 2018

Four scientists analyzed the article and estimate its overall scientific credibility to be 'low'.

A majority of reviewers tagged the article as: Biased Misleading.

Review Summary 

This article in The Australian covers a new study published in Nature that concludes global warming played a key role in the recent large-scale bleaching and mortality of corals in the Great Barrier Reef. Based on the comments of a single oceanographer (Prof. Kaempf), the article was headlined “Not all scientists agree on cause of Great Barrier Reef damage”.

The scientists who reviewed this article found that this source’s comments in the story are unsupported by evidence and prior research, and therefore The Australian article misleads readers by emphasizing a “debate” that does not actually exist among researchers studying the Great Barrier Reef. 

The Australian’s coverage of Great Barrier Reef study creates perception that scientists are divided by Scott Johnson, Climate Feedback, Apr 22, 2018


SkS Week in Review... 


97 Hours of Consensus...

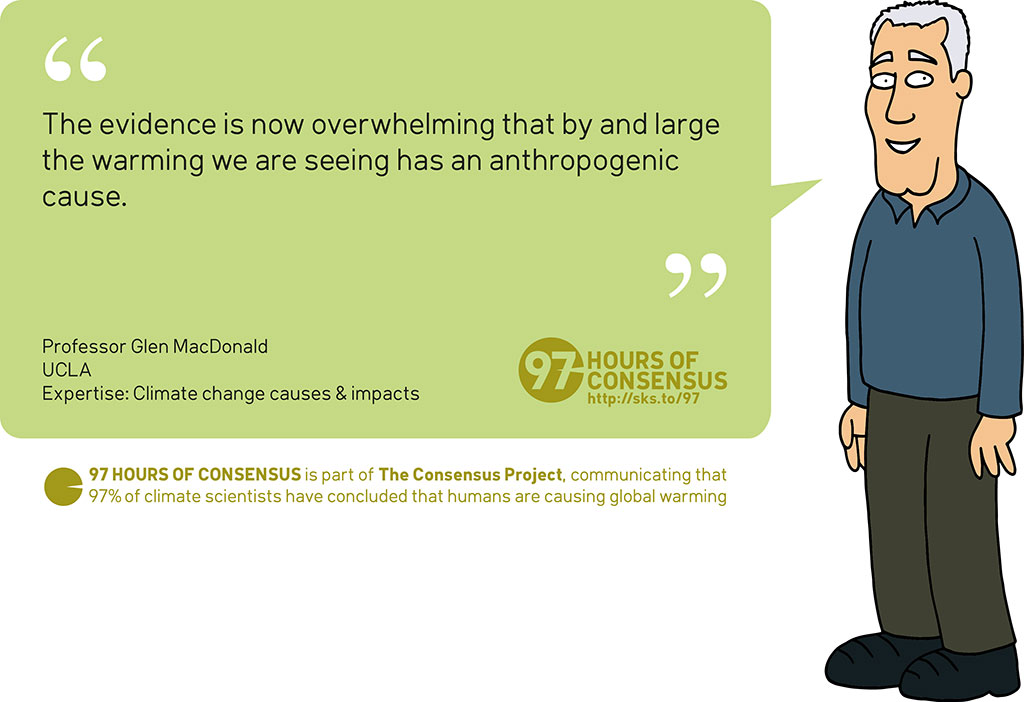
97 Hours: Glen MacDonald


Glen MacDonald's bio page and quote source

High resolution JPEG (1024 pixels wide)


from Skeptical Science https://ift.tt/2FoVvYA

Our line of sight to bright planets today

View larger. | Chart for April 29, 2018, by Guy Ottewell.

Re-printed with permission from Guy Ottewell’s blog; click here to visit him.

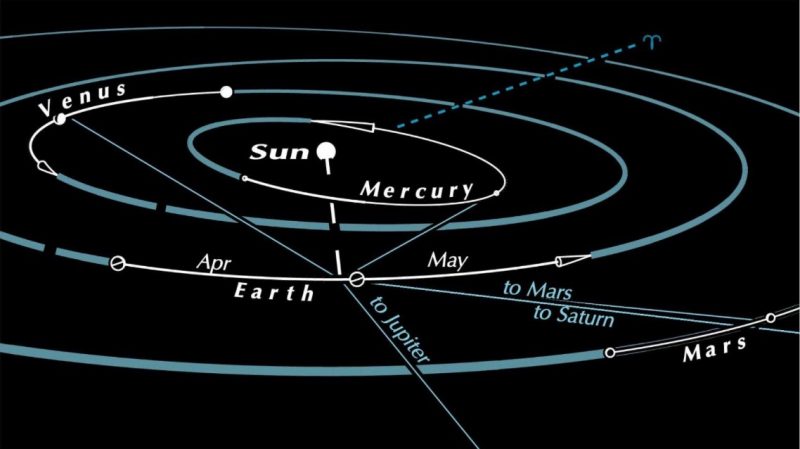
Here is a picture to show you the state of the solar system. The view is from 15 degrees north of the ecliptic plane, at longitude 217 degrees and 6 astronomical units from the sun. The dashed line is the vernal equinox direction (where the sun appeared to be at the March 20 equinox). The purpose is to show the paths of the planets in April and May, and sightlines from Earth to them at April 29.

You can see that the only planet in the evening sky, that is, to the “left” (east) of the sun, is Venus, still slowly climbing in that direction.

Jupiter – which is near the moon this weekend – will move into the evening sky, that is, reach opposition and be highest at midnight, on May 9. Farther on the morning side, Mars and Saturn make a group; Mars passed Saturn on April 2.

And lower, into the morning twilight, Mercury is on April 29 at greatest elongation, or angular distance from the sun.

View larger. | Chart by Guy Ottewell.

Mercury’s elongation is indeed the greatest for this year (27 degrees). And yet, because of the angle at which it comes slanting out from our north-hemisphere horizon, this is the worst, that is, worst of Mercury’s appearances from our Northern Hemisphere perspective – the paradox caused by the small planet’s oblique orbit.

Meanwhile, from the Southern Hemisphere, Mercury is at its best

Bottom line: Bright planets Jupiter, Saturn, Mars, Venus, Mercury as seen from above the solar system – with the line of sight from Earth marked – on April 29, 2018.

Read more: EarthSky’s guide to the bright planets


from EarthSky https://ift.tt/2HA3TdR

How to see Jupiter’s moons

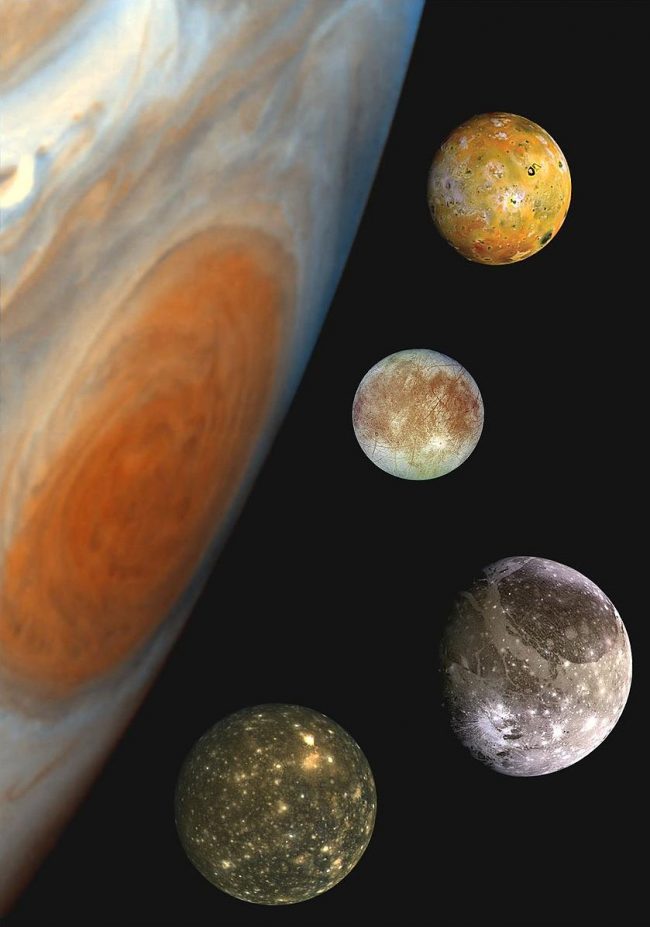
Composite image of Jupiter and its 4 Galilean moons. From top to bottom the moons are Io, Europa, Ganymede, Callisto. The Galileo spacecraft obtained the images to make this composite in 1996. Image via NASA PhotoJournal.

If you have binoculars or a telescope, it’s fairly easy whenever Jupiter is visible to see the giant planet’s four largest moons. They look like pinpricks of light – like tiny “stars” – all on or near the same plane crossing the planet. They’re often called the Galilean moons to honor Galileo, who discovered them in 1610.

In their order from Jupiter, these moons are Io, Europa, Ganymede and Callisto.

Writing in 2014 at SkyandTelescope.com, Kelly Beatty said:

… put a low-power eyepiece in your telescope and center Jupiter. Focus carefully so that the planet’s edge is as sharp as possible, let any vibrations settle down, and then take a good long look.

Depending on the size of your scope and the quality of the night’s seeing … you’ll probably see all four, but possibly only three depending on when you look. The count often changes from night to night (or if you’re patient, even from hour to hour). That’s because while orbiting Jupiter they sometimes glide in front of the planet, behind it, or through its shadow.

These hide-and-seek movements confounded Galileo Galilei when he first spied these ‘stars’ in 1610. But he soon realized they were actually circling around Jupiter, forming a miniature solar system of sorts. We see their orbits almost exactly edge on.

…Callisto is usually (but not always) farthest from Jupiter, and Ganymede is a little brighter than the others. Sulfur-coated Io has a pale yellow-orange cast. Still not sure? The answers are just a mouse clicks away, thanks to SkyandTelescope.com’s handy guide to identifying the Galilean satellites at any time and date.

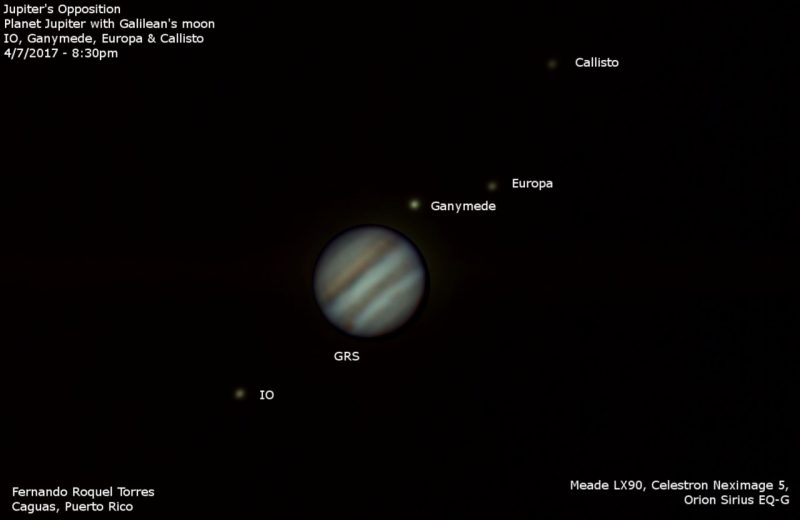
Fernando Roquel Torres in Caguas, Puerto Rico, captured Jupiter, the Great Red Spot (GRS) and all 4 of its largest moons – the Galilean satellites – on the date of Jupiter’s 2017 opposition (April 7).

Jupiter and three of its four Galilean satellites, as they would appear in a small telescope. Illustration via SkyandTelescope.com.

As Kelly said, the Galilean moons orbit Jupiter around its equator. We do see their orbits almost exactly edge-on, but, as with so much in astronomy, there’s a cycle for viewing the edge-on-ness of Jupiter’s moons. This particular cycle is six years long. That is, every six years, we view Jupiter’s equator – and the moons orbiting above its equator – most edge-on.

And that’s why, in 2015, we were able to view a number of mutual events (eclipses and shadow transits) involving Jupiter’s moons, through telescopes.

Starting in late 2016, Jupiter’s axis began tilting enough toward the sun and Earth so that the outermost of the four moons, Callisto, has not been passing in front of Jupiter or behind Jupiter, as seen from our vantage point. This will continue for a period of about three years, during which time Callisto is perpetually visible to those with telescopes, alternately swinging above and below Jupiter as seen from Earth.

Click here for a Jupiter’s moons almanac, courtesy of SkyandTelescope.com.

Click here for recommended sky almanacs; they can tell you Jupiter’s rising time in your sky.

Bottom line: How to see Jupiter’s moons.


from EarthSky https://ift.tt/2jgkncu

Humans stalked giant sloth

Video via The Washington Post

By Matthew Robert Bennett, Bournemouth University; Katie Thompson, Bournemouth University, and Sally Christine Reynolds, Bournemouth University

Rearing on its hind legs, the giant ground sloth would have been a formidable prey for anyone, let alone humans without modern weapons. Tightly muscled, angry and swinging its forelegs tipped with wolverine-like claws, it would have been able to defend itself effectively. Our ancestors used misdirection to gain the upper hand in close-quarter combat with this deadly creature.

What is perhaps even more remarkable is that we can read this story from the 10,000-year-old footprints that these combatants left behind, as revealed by our new research published April 25, 2018, in Science Advances. Numerous large animals such as the giant ground sloth – so-called megafauna – became extinct at the end of the Ice Age. We don’t know if hunting was the cause but the new footprint evidence tells us how human hunters tackled such fearsome animals and clearly shows that they did.

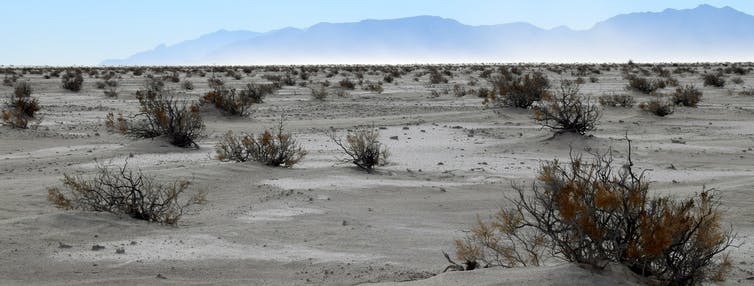
White Sands National Monument. Image via Matthew Bennett, Bournemouth University.

These footprints were found at White Sands National Monument in New Mexico, U.S., on part of the monument used by the military. The White Sands Missile Range, located close to the Trinity nuclear site, is famous as the birthplace of the U.S. space program, of Ronald Reagan’s Star Wars initiative and of countless missile tests. It is now a place where long-range rather than close-quarter combat is fine-tuned.

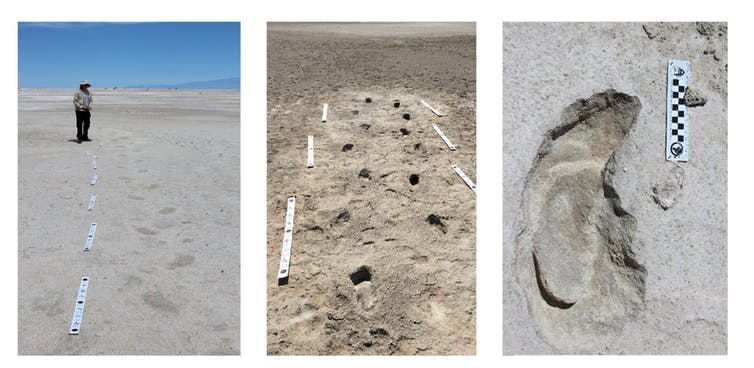
Tracking the footprints. Image via Matthew Bennett, Bournemouth University.

It is a beautiful place, home to a huge salt playa (dry lake) known as Alkali Flat and the world’s largest gypsum dune field, made famous by numerous films including “Transformers” and “The Book of Eli.” At the height of the Ice Age it was home to a large lake (paleo Lake Otero).

As the climate warmed, the lake shrank and its bed was eroded by the wind to create the dunes and leave salt flats that periodically pooled water. The Ice Age megafauna left tracks on these flats, as did the humans that hunted them. The tracks are remarkable in that they are only a few centimeters beneath the surface and yet have been preserved for over 10,000 years.

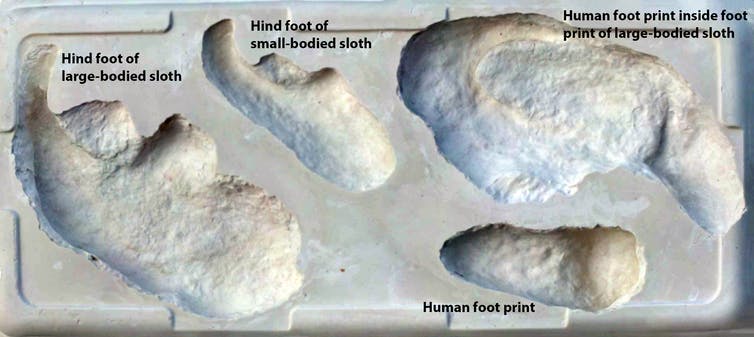
Footprint comparison. Image via David Bustos, National Park Service.

Here there are tracks of extinct giant ground sloth, of mastodon, mammoth, camel and dire wolf. These tracks are colloquially known as “ghost tracks” as they are only visible at the surface during specific weather conditions, when the salt crusts are not too thick and the ground not too wet. Careful excavation is possible in the right conditions and reveals some amazing features.

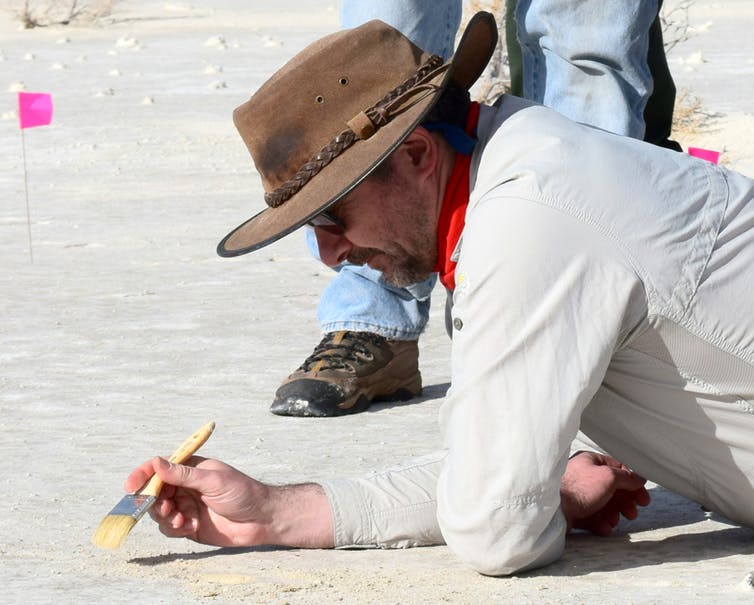
Perhaps the coolest of these is a series of human tracks that we found within the sloth prints. In our paper, produced with a large number of colleagues, we suggest that the humans stepped into the sloth prints as they stalked them for the kill. We have also identified large “flailing circles” that record the sloth rising up on its hind legs and swinging its fore legs, presumably in a defensive, sweeping motion to keep the hunters at bay. As it overbalanced, it put its knuckles and claws down to steady itself.

Plaster cast footprints. Image via David Bustos, National Park Service.

These circles are always accompanied by human tracks. Over a wide area, we see that where there are no human tracks, the sloth walk in straight lines. Where human tracks are present, the sloth trackways show sudden changes in direction suggesting the sloth was trying to evade its hunters.

Piecing together the puzzle, we can see how sloth were kept on the flat playa by a horde of people who left tracks along the its edge. The animal was then distracted by one stalking hunter, while another crept forward and tried to strike the killing blow. It is a story of life and death, written in mud.

Matthew Bennett, dusting for prints. Image via David Bustos, National Park Service.

What would convince our ancestors to engage is such a deadly game? Surely the bigger the prey, the greater the risk? Maybe it was because a big kill could fill many stomachs without waste, or maybe it was pure human bravado.

At this time at the end of the last Ice Age, the Americas were being colonized by humans spreading out over the prairie plains. It was also a time of animal extinctions. Many paleontologists favor the argument that human over-hunting drove this wave of extinction and for some it has become an emblem of early human impact on the environment. Others argue that climate change was the true cause and our species is innocent.

The ConversationIt is a giant crime scene in which footprints now play a part. Our data confirms that human hunters were attacking megafauna and were practiced at it. Unfortunately, it doesn’t cast light on the impact of that hunting. Whether humans were the ultimate or immediate cause of the extinction is still not clear. There are many variables including rapid environmental change to be considered. But what is clear from tracks at White Sands is that humans were then, as now, “apex predators” at the top of the food chain.

Matthew Robert Bennett, Professor of Environmental and Geographical Sciences, Bournemouth University; Katie Thompson, Research Associate, Bournemouth University, and Sally Christine Reynolds, Senior Lecturer in Hominin Palaeoecology, Bournemouth University

This article was originally published on The Conversation. Read the original article.

Bottom line: Fossil footprints show humans tracking a giant sloth.


from EarthSky https://ift.tt/2JBbFQZ

Full moon is April 29-30

Man and moonset – March 1, 2018 – from Martin Marthadinata in Surabaya, East Java, Indonesia.

For general reference, we say a full moon is full all night. Because, in order to look full, the moon has to be more or less opposite the sun, every full moon rises in the east around sunset and climbs highest up for the night midway between sunset and sunrise (around midnight). Every full moon sets around sunup. That’s true as seen from around the globe.

But, technically speaking, the moon is full only at the instant that it’s 180o from the sun in ecliptic longitude. The moon turns full on April 30, 2018 at 00:58 UTC, which at North American time zones translates to April 29 at 9:58 p.m. ADT, 8:58 p.m. EDT, 7:58 p.m. CDT, 6:58 p.m. MDT and 5:58 p.m. PDT.

This full moon will be near a very bright planet, Jupiter, as shown on the chart below:

The moon is near the dazzling planet Jupiter on the night of April 28-30, 2018.

Here’s something else fun about this April 2018 full moon, and, in fact, about most full moons. That is, it won’t undergo an eclipse. In fact, the April 2018 full moon swings a whopping 5o (10 moon diameters) north of the ecliptic, the plane of Earth’s orbit around the sun. So it misses being in Earth’s shadow by a wide margin.

Some full moons come closer to passing through Earth’s shadow – that is, closer to being in eclipse without actually doing so – but the fact is that most full moons fail to reside at the antisolar point, the point that’s directly opposite the sun. It’s only when the moon passes through or very close to the antisolar point that we see a total eclipse of the moon.

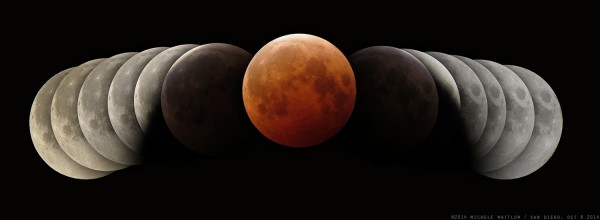
October 8, 2014 total lunar eclipse composite by Michele Whitlow.

The next two full moons – May and June 2018 – will pass to the north of the ecliptic and the antisolar point, too. So there will be no lunar eclipse in May or June 2018.

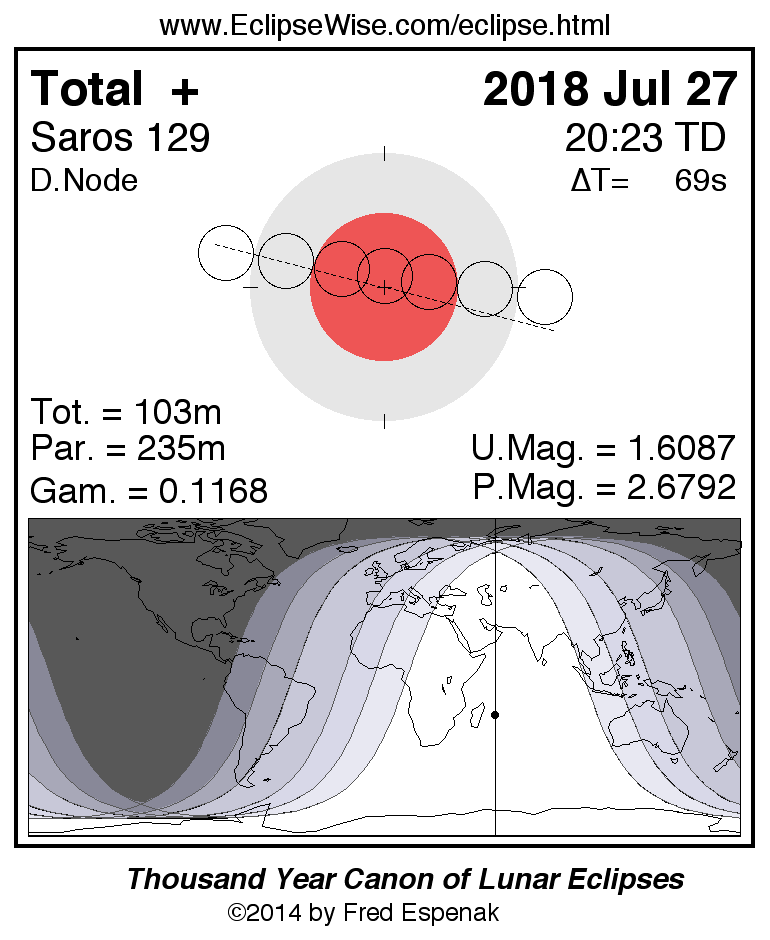
The July 2018 full moon will sweep right through the antisolar point. The center of the full moon will pass a scant one-tenth of a degree north of the ecliptic. So, if you’re on the right place on Earth, you’ll see a total lunar eclipse on July 27, 2018.

This total lunar eclipse on July 27 comes one fortnight (two weeks) after the partial solar eclipse of July 13, 2018, and one fortnight (two weeks) before the partial solar eclipse on August 11, 2018.

Read more: Why no eclipse at every full and new moon?

Worldwide map of the total eclipse of the moon via EclipseWise. Note that the full moon passes right over the antisolar point (the + at the center of the Earth’s shadow). Click here for a more detailed chart.

This April full moon is the second full moon after the March equinox. In North America, we’ll call it the Pink Moon, Grass Moon or Egg Moon. Meanwhile, in the Southern Hemisphere, this full moon is called the Hunter’s Moon, the full moon that immediately follows the Harvest Moon.

Read more: What are the full moon names?

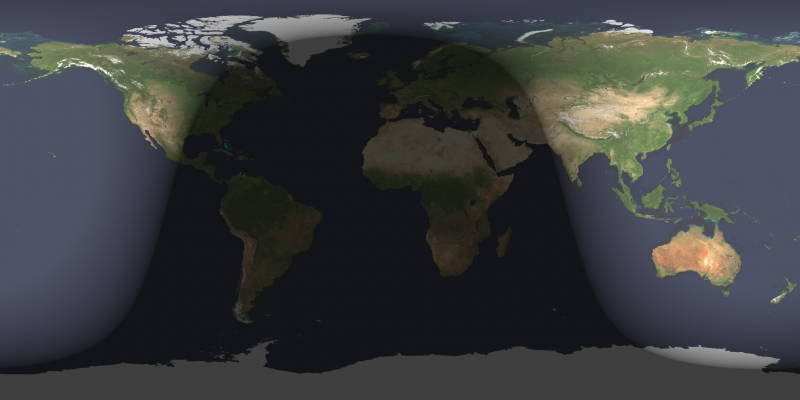
Worldwide map via the US Naval Observatory, showing the daytime and nighttime sides of Earth at the instant of full moon (2018 April 30 at 00:58 UTC). The shadow line at left (running through the US) depicts sunset April 29, and the shadow line at right represents sunrise April 30.

Bottom line: From the world’s western hemisphere, the moon is full on the night of April 29, 2018. From the eastern hemisphere, it’s full on April 30. It swings a whopping 5o (10 moon diameters) north of the plane of Earth’s orbit around the sun and misses being in Earth’s shadow by a wide margin.

Four keys to understanding moon phases

Can you tell me the full moon names?


from EarthSky https://ift.tt/1iAoPbQ

Take a virtual tour of 6 exoplanets

Take a first-person journey across the landscape of six exoplanets in this virtual exoplanet tour, above. The planets include Wasp-121b, a world whose atmosphere is being driven off by its parent star; Kepler-62e, which may be covered by a deep ocean and ravaged by monster waves; and 55 Cancri e, a hellish world likely covered in vast lava flows and engulfed in huge lightning storms. The virtual tour – with its 360-degree visual display – was designed and created by astrophysicists from the University of Exeter, in conjunction with the science center We The Curious in Bristol, U.K., and visual effects artists from Cornwall-based animation studio Engine House.

The tour has had over a million YouTube views since launching in late 2017.

Astronomer Nathan Mayne of the University of Exeter said in a statement:

It is great to know that our research into distant planets has fascinated so many people. However, more importantly hopefully through this video we have been able to explain and demystify our research enabling everyone to understand and get excited about our exploration of the planets in our galaxy … The mini-documentary gives a snapshot of astrophysical techniques, and what we have learned about planets using them.

Ross Exton, video producer for We The Curious, added:

I wanted to create something I’d never seen before. By collaborating with talented visual effects artists and astrophysicists currently studying these exoplanets, we were able to create a series of visuals which are not only stunning, but are informed by real scientific research.

Bottom line: Take a virtual tour of six exoplanets.

Via University of Exeter


from EarthSky https://ift.tt/2FpXBaJ

Will you see Mercury before sunrise?

Looking for info on the April 29-30 full moon? Click here

In late April 2018, the sun’s innermost planet Mercury swings to its greatest western elongation from the sun, that is, its farthest point west of the sun in our sky for this morning apparition. Mercury is 27 degrees west of the sun at its farthest, this time around. It’s low in the eastern sky before sunrise. Farthest from the sunrise … sounds easiest to view, right? That’s true for the Southern Hemisphere; this is Mercury’s best apparition in the morning sky for all of 2018 for southerly latitudes. Yet at northerly latitudes, this is Mercury’s poorest showing in the morning sky for the year.

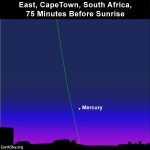
The featured sky chart above is especially for the Southern Hemisphere. It’s specifically for Cape Town, South Africa, which is roughly the same latitude as Sydney, Australia and Auckland, New Zealand and Santiago, Chile. Given an unobstructed eastern horizon, all these places should be able to view Mercury with the eye alone in a predawn sky. At temperate latitudes in the Southern Hemisphere (South Africa, southern Australia, New Zealand), Mercury rises better than 2 hours before the sun.

Meanwhile, at mid-northern latitudes (United States and Europe), Mercury comes up about an hour before sunrise, and mid-northern latitudes will find Mercury deeply buried in the glow of twilight.

That’s in spite of the fact that this present morning apparition will last for yet another month.

Click here for a recommended almanacs; an almanac can give you Mercury’s rising time in your sky.

At northerly latitudes, the shallow angle of the ecliptic – the pathway of the sun, moon and planets – on springtime mornings keeps Mercury buried in the glare of sunrise.

Why is this morning showing of Mercury so outstanding from the Southern Hemisphere, but so poor in the Northern Hemisphere? Mercury’s distance west of the sun (27 degrees) is the same for the whole Earth. Here’s what’s different. The ecliptic – the roadway of the sun, moon and planets across the sky – makes a narrow angle with the predawn horizon in spring. Meanwhile, in autumn, it makes an exceptionally steep angle (nearly perpendicular) with the predawn horizon … and it’s autumn now south of the equator.

Bottom line: If you live in the Southern Hemisphere, late April and early May 2018 present your best opportunity of 2018 to spot Mercury, the innermost planet, in east before sunrise.


from EarthSky https://ift.tt/2r8qYt0

2018 SkS Weekly Climate Change & Global Warming News Roundup #17

A chronological listing of news articles posted on the Skeptical Science Facebook Page during the past week.

Editor's Pick

Global temperatures have dropped since 2016. Here’s why that’s normal. 

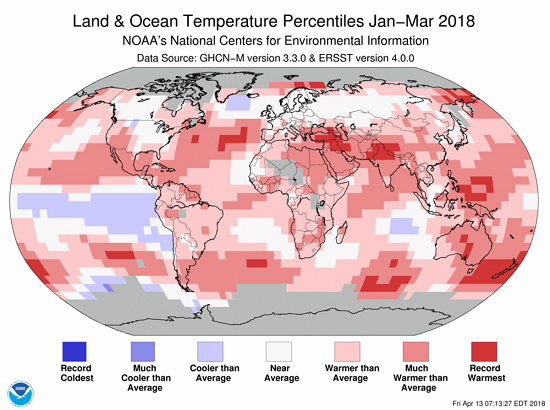
 Jan-Mar 2018 Global Temp Percentiles NOAA

It was only two years ago that a new record-warm global temperature was set, but things have already cooled off significantly. Temperature anomalies hit record peaks in 2016 but have been sliding since then. Global temperatures are still much warmer than normal, but according to NASA, the first quarter of 2018 (January-March) was the fourth warmest, behind 2015, 2016, 2017 and tied with 2010.

This is normal, of course. The world has not seen the last of global warming. The long-term upward trend in temperatures is the result of  man-made fossil fuel emissions, but natural processes that affect global temperature — like El Niño — still play a role. Sometimes they make things warmer and sometimes they make things cooler.

The current cooling episode is mostly the result of a reversal of waters in the Tropical Pacific, which can modulate global temperature. Since the Pacific Ocean is our largest global body of water, what it does makes a big difference on global climate. A similar reversal followed the super El Niño in the late ’90s — 1998 was the hottest year on record at the time in part because of the warm El Niño water pushing global temperatures over the brink. Earth went from having one of the strongest El Niño events on record (very warm waters in the central Tropical Pacific) to a few years of cooler waters, thanks to a La Niña period. 

Global temperatures have dropped since 2016. Here’s why that’s normal. by Matt Rogers, Capital Weather Gang, Washington Post, Apr 26, 2018 


Links posted on Facebook

Sun Apr 22, 2018

Mon Apr 23, 2018

Tue Apr 24, 2018

Wed Apr 25, 2018

Thu Apr 26, 2018

Fri Apr 27, 2018

Sat Apr 28, 2018


from Skeptical Science https://ift.tt/2JB7Wmm