Editor's Pick
Stanford law and science experts discuss court case that could set precedent for climate change litigation
A closely watched federal trial pitting two cities against major oil companies has taken surprising and unorthodox turns. Stanford researchers examine the case, which could reshape the landscape of legal claims for climate change-related damages.
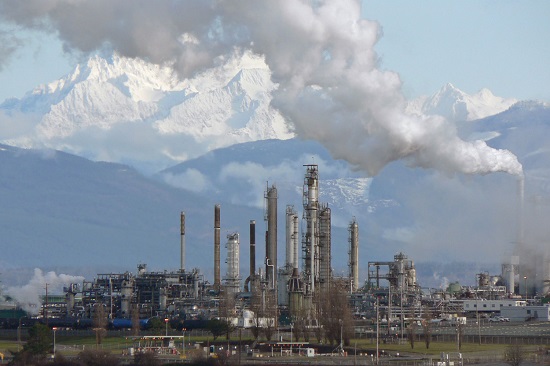
A federal trial pitting two cities against major oil companies could reshape the landscape of legal claims for climate change-related damages. (Image credit: Walter Siegmund/Wikimedia Commons)
A judge in California took an unusual step in trying to untangle who is to blame for increasingly frequent droughts, floods and other climate change-related extreme weather. The case in San Francisco is weighing the question of whether climate change damages connected to the burning of oil are specifically the fault of the companies that extract and sell it.
The judge in People of the State of California v. BP P.L.C. et al. had both the plaintiffs – the cities of Oakland and San Francisco – and the defendants – several major oil companies – answer basic questions about climate change in a tutorial format. Counter to what some might have expected, an oil company lawyer largely confirmed the consensus science on the issue, but challenged the idea that oil companies should be held accountable.
Stanford Report spoke with Katharine Mach, a senior research scientist at the School of Earth, Energy & Environmental Science, and Deborah Sivas, the Luke W. Cole Professor of Environmental Law, to get their perspectives on the climate tutorial, the science in question and the role of the judiciary in confronting climate change challenges.
Stanford law and science experts discuss court case that could set precedent for climate change litigation by Rob Jordon, Stanford News, Mar 30, 2018
Links posted on Facebook
Sun Mar 25, 2018
- Macron pushes for EU minimum price for carbon by Richard Lough, Reuters, Mar 22, 2018
- ‘We want to repower NSW’: thousands rally against coal in Sydney by Helen Davidson, Environment, Guardian, Mar 24, 2018
- A Heat Wave Left Arctic Sea Ice Near a Record Winter Low. This Town Is Paying the Price. by Sabrina Shankman, InsideClimate News, Mar 23, 2018
- Is Partisanship the New Religion? by Jeremy Deaton, Nexus Media News, Mar 20, 2018
- National Flood Insurance Is Underwater Because of Outdated Science by Jen Schwartz, Scientific American, Mar 23, 2018
- Arctic Sea Ice Missed a Record Low This Winter. Barely. by Kendra Pierre-Louis, Nadja Popovich & Adam Pearce, Climate, New York Times, Mar 23, 2018
- Darren Aronofsky’s New TV Series Breaks With The Hollywood Playbook On Climate Change by Alexander C Kaufman, HuffPost, Mar 26, 2018
- How Do Big Oil Companies Talk about Climate Science? Four Takeaways from a Day in Court by Kristina Dahl, Union of Concerned Scientists, Mar 22, 2018
Mon Mar 26, 2018
- Good news about renewables: but the heat is still on to cut fossil fuel use, Business Leader, Observer/Guardian, Mar 25, 2018
- Threatened blue carbon ecosystems store carbon 40 times faster than forests by Joanna Kahn, ABC News (AU), Mar 26. 2018
- Adjusting your sails for the winds of climate change, NewsRoom (NZ), Mar 26, 2018
- Study: wind and solar can power most of the United States by John Abraham, Climate Consensus - the 97%, Environment, Guardian, Mar 26, 2018
- The Paris Climate Accords Are Looking More and More Like Fantasy by David Wallace-Wells, The Intelligencer, New York Magazine, Mar 25, 2018
- Half of Alberta's boreal forest could disappear due to fires and climate change by Colette Derworiz, Canadian Press, CBC, Mar 26, 2018
- One of World's Dirtiest Oil Sources Wants to Go Green by Jim Efstathiou Jr & Kevin Orland, Bloomberg News, Mar 26, 2018
Tue Mar 27, 2018
- Europe's $38 Billion Carbon Market Is Finally Doing Its Job by Jeremy Hodges, Ewa Krukowska, & Mathew Carr, Bloomberg News, Mar 26, 2018
- Arctic sea ice hits second-lowest winter peak on record by Robert McSweeney, Carbon Brief, Mar 26, 2018
- Judge: Trump Admin. Must Consider Climate Change in Major Drilling and Mining Lease Plan by Neela Banerjee, InsideClimate News, Mar 26, 2018
- Megadisasters devastated America in 2017. And they’re only going to get worse. by Umair Irfan & Brian Resnick, Energy & Environment, Vox, Mar 26, 2018
- Land degradation now at a critical level warn experts by Catherine Harte, Ecologist, Mar 26, 2018
- In Climate Tutorial, Oil Industry Doubles Down on Science Uncertainty by Amy Westervelt, Climate Liability News, Mar 22, 2018
- Shell — yes, that Shell — just outlined a radical scenario for what it would take to halt climate change by Chris Mooney & Steven Mufson, Energy & Environment, Washington Post, Mar 26, 2018
- Hotting up: how climate change could swallow Louisiana's Tabasco island by Oliver Milman, Environment, Guardian, Mar 27, 2018
Wed Mar 28, 2018
- Runaway Arctic Ice Menaces Oil Rigs and Shipping as the Planet Warms by Bob Berwyn, InsideClimate News, Mar 27, 2018
- New Canadian Bill Would Help Cities Sue Oil Industry for Climate Damages by Karen Savage, Climate Liability News, Mar 26, 2018
- Is the IEA underestimating renewables? by Gero Rueter. Deutsche Welle (DW), Mar 26, 2018
- Aging Wind Farms Are Repowering with Longer Blades, More Efficient Turbines by Lindsey Gilpin, InsideClimate News, Mar 26, 2018
- Flooding and heavy rains rise 50% worldwide in a decade, figures show by Arthur Neslen, Environment, Guardian, Mar 21, 2018
- How the Global Warming Information Mode Scrambles Ecological Understanding by Timothy Morton, Earth Island Journal, Mar 27, 2018
- Leaked Memo: EPA Shows Workers How To Downplay Climate Change by Alexander C. Kaufman, Politics, HuffPost, Mar 28, 2018
- Climate Change Is Becoming a Top Threat to Biodiversity by Chelsea Harvey, E&E News/Scientific American, Mar 28, 2018
Thu Mar 29, 2018
- Q&A: What does ‘subsidy-free’ renewables actually mean? by Simon Evans, Carbon Brief, Mar 27, 2018
- The Climate Is Changing For Climate Skeptics by Amy Westervelt, Environment, Huffpost, Mar 23, 2018
- Canada's climate gap twice as big as claimed - 59 million tonne carbon snafu by Barry Saxifrage, Climate, National Observer, Mar 27, 2018
- Chevron just agreed in court that humans cause climate change, setting a new legal precedent by Umair Irfan, Energy & Environment, Vox, Mar 28, 2018
- Ice cores show Greenland’s melting is unprecedented in at least four centuries by Chris Mooney, Energy & Environment, Washington Post, Mar 28, 2018
- Climate scientists debate a flaw in the Paris climate agreement by Dana Nuccitelli, Climate Consensus - The 97%, Guardian, Mar 29, 2018
- Partisan split on climate grows, even as U.S. fears are on the rise, poll finds by Steven Mufson, Energy & Environment, Washington Post, Mar 28, 2018
- Federal report: High-tide flooding could happen ‘every other day’ by late this century by Jason Samenow, Captial Weather Gang, Washington Post, Mar 28, 2018
Fri Mar 30, 2018
- How could global warming accelerate if CO2 is 'logarithmic'? by DPiepgrass, SkepticalScience, Mar 25, 2018
- The Sahara is growing, thanks in part to climate change by Darryl Fears, Energy & Environment, Washington Post, Mar 29, 2018
- About half of Americans don’t think climate change will affect them — here’s why by Alessandra Potenza, The Verge, Mar 29, 2018
- Federal Judge Dismisses Exxon Lawsuit Challenging State Climate Probes by Karen Savage, Climate Liability News, Mar 29, 2018
- Big Oil’s Business Model Could Be on the Verge of Failing by Geoff Dembicki, Vice, Mar 27, 2018
- Buried, altered, silenced: 4 ways government climate information has changed since Trump took office by Morgan Currie & Britt S. Paris, The Conversation US, Mar 24, 2018
- ‘We’re Talking Very Big Bucks’: New Bill Could Put Oil Companies on the Hook for Climate Change Costs by Jimmy Thomson, DeSmog Canada, Mar 28, 2018
- Mapped: Cambridge Analytica’s Ties to the Fossil Fuel Industry by Mat Hope, DeSmog UK, Mar 29, 2018
Sat Mar 31, 2018
- Why India’s CO2 emissions grew strongly in 2017, Guest Post by Robbie Andrews, Carbon Brief, Mar 28, 2018
- NOAA Report: Today’s Damaging Floods Will Be Tomorrow’s High Tides by Bob Henson, Category 6, Weather Underground, Mar 28, 2018
- In-depth: Is Shell’s new climate scenario as ‘radical’ as it says? by Simon Evans, Carbon Brief, Mar 29, 2018
- Trump distracts America from the task of facing three existential threats, Opinion by Michael H Fuchs, Guardian, Mar 30, 2018
- Independents Are Shifting To Climate Denial, According To The Latest Gallup Poll by Alexander C Kaufman, HuffPost, Mar 30, 2018
- Stanford law and science experts discuss court case that could set precedent for climate change litigation by Rob Jordon, Stanford News, Mar 30, 2018
- To Supercharge Chinese Renewables, Fix Their Financing by Miao Hong & Ye Wang, World Resources Insittute (WRI). Mar 27, 2018
- California Bans Climate-Warming HFCs in New Air-Conditioning and Refrigeration by Sabrina Shankman, InsideClimate News, Mar 30, 2018
from Skeptical Science https://ift.tt/2pTvcEZ
Editor's Pick
Stanford law and science experts discuss court case that could set precedent for climate change litigation
A closely watched federal trial pitting two cities against major oil companies has taken surprising and unorthodox turns. Stanford researchers examine the case, which could reshape the landscape of legal claims for climate change-related damages.
A federal trial pitting two cities against major oil companies could reshape the landscape of legal claims for climate change-related damages. (Image credit: Walter Siegmund/Wikimedia Commons)
A judge in California took an unusual step in trying to untangle who is to blame for increasingly frequent droughts, floods and other climate change-related extreme weather. The case in San Francisco is weighing the question of whether climate change damages connected to the burning of oil are specifically the fault of the companies that extract and sell it.
The judge in People of the State of California v. BP P.L.C. et al. had both the plaintiffs – the cities of Oakland and San Francisco – and the defendants – several major oil companies – answer basic questions about climate change in a tutorial format. Counter to what some might have expected, an oil company lawyer largely confirmed the consensus science on the issue, but challenged the idea that oil companies should be held accountable.
Stanford Report spoke with Katharine Mach, a senior research scientist at the School of Earth, Energy & Environmental Science, and Deborah Sivas, the Luke W. Cole Professor of Environmental Law, to get their perspectives on the climate tutorial, the science in question and the role of the judiciary in confronting climate change challenges.
Stanford law and science experts discuss court case that could set precedent for climate change litigation by Rob Jordon, Stanford News, Mar 30, 2018
Links posted on Facebook
Sun Mar 25, 2018
- Macron pushes for EU minimum price for carbon by Richard Lough, Reuters, Mar 22, 2018
- ‘We want to repower NSW’: thousands rally against coal in Sydney by Helen Davidson, Environment, Guardian, Mar 24, 2018
- A Heat Wave Left Arctic Sea Ice Near a Record Winter Low. This Town Is Paying the Price. by Sabrina Shankman, InsideClimate News, Mar 23, 2018
- Is Partisanship the New Religion? by Jeremy Deaton, Nexus Media News, Mar 20, 2018
- National Flood Insurance Is Underwater Because of Outdated Science by Jen Schwartz, Scientific American, Mar 23, 2018
- Arctic Sea Ice Missed a Record Low This Winter. Barely. by Kendra Pierre-Louis, Nadja Popovich & Adam Pearce, Climate, New York Times, Mar 23, 2018
- Darren Aronofsky’s New TV Series Breaks With The Hollywood Playbook On Climate Change by Alexander C Kaufman, HuffPost, Mar 26, 2018
- How Do Big Oil Companies Talk about Climate Science? Four Takeaways from a Day in Court by Kristina Dahl, Union of Concerned Scientists, Mar 22, 2018
Mon Mar 26, 2018
- Good news about renewables: but the heat is still on to cut fossil fuel use, Business Leader, Observer/Guardian, Mar 25, 2018
- Threatened blue carbon ecosystems store carbon 40 times faster than forests by Joanna Kahn, ABC News (AU), Mar 26. 2018
- Adjusting your sails for the winds of climate change, NewsRoom (NZ), Mar 26, 2018
- Study: wind and solar can power most of the United States by John Abraham, Climate Consensus - the 97%, Environment, Guardian, Mar 26, 2018
- The Paris Climate Accords Are Looking More and More Like Fantasy by David Wallace-Wells, The Intelligencer, New York Magazine, Mar 25, 2018
- Half of Alberta's boreal forest could disappear due to fires and climate change by Colette Derworiz, Canadian Press, CBC, Mar 26, 2018
- One of World's Dirtiest Oil Sources Wants to Go Green by Jim Efstathiou Jr & Kevin Orland, Bloomberg News, Mar 26, 2018
Tue Mar 27, 2018
- Europe's $38 Billion Carbon Market Is Finally Doing Its Job by Jeremy Hodges, Ewa Krukowska, & Mathew Carr, Bloomberg News, Mar 26, 2018
- Arctic sea ice hits second-lowest winter peak on record by Robert McSweeney, Carbon Brief, Mar 26, 2018
- Judge: Trump Admin. Must Consider Climate Change in Major Drilling and Mining Lease Plan by Neela Banerjee, InsideClimate News, Mar 26, 2018
- Megadisasters devastated America in 2017. And they’re only going to get worse. by Umair Irfan & Brian Resnick, Energy & Environment, Vox, Mar 26, 2018
- Land degradation now at a critical level warn experts by Catherine Harte, Ecologist, Mar 26, 2018
- In Climate Tutorial, Oil Industry Doubles Down on Science Uncertainty by Amy Westervelt, Climate Liability News, Mar 22, 2018
- Shell — yes, that Shell — just outlined a radical scenario for what it would take to halt climate change by Chris Mooney & Steven Mufson, Energy & Environment, Washington Post, Mar 26, 2018
- Hotting up: how climate change could swallow Louisiana's Tabasco island by Oliver Milman, Environment, Guardian, Mar 27, 2018
Wed Mar 28, 2018
- Runaway Arctic Ice Menaces Oil Rigs and Shipping as the Planet Warms by Bob Berwyn, InsideClimate News, Mar 27, 2018
- New Canadian Bill Would Help Cities Sue Oil Industry for Climate Damages by Karen Savage, Climate Liability News, Mar 26, 2018
- Is the IEA underestimating renewables? by Gero Rueter. Deutsche Welle (DW), Mar 26, 2018
- Aging Wind Farms Are Repowering with Longer Blades, More Efficient Turbines by Lindsey Gilpin, InsideClimate News, Mar 26, 2018
- Flooding and heavy rains rise 50% worldwide in a decade, figures show by Arthur Neslen, Environment, Guardian, Mar 21, 2018
- How the Global Warming Information Mode Scrambles Ecological Understanding by Timothy Morton, Earth Island Journal, Mar 27, 2018
- Leaked Memo: EPA Shows Workers How To Downplay Climate Change by Alexander C. Kaufman, Politics, HuffPost, Mar 28, 2018
- Climate Change Is Becoming a Top Threat to Biodiversity by Chelsea Harvey, E&E News/Scientific American, Mar 28, 2018
Thu Mar 29, 2018
- Q&A: What does ‘subsidy-free’ renewables actually mean? by Simon Evans, Carbon Brief, Mar 27, 2018
- The Climate Is Changing For Climate Skeptics by Amy Westervelt, Environment, Huffpost, Mar 23, 2018
- Canada's climate gap twice as big as claimed - 59 million tonne carbon snafu by Barry Saxifrage, Climate, National Observer, Mar 27, 2018
- Chevron just agreed in court that humans cause climate change, setting a new legal precedent by Umair Irfan, Energy & Environment, Vox, Mar 28, 2018
- Ice cores show Greenland’s melting is unprecedented in at least four centuries by Chris Mooney, Energy & Environment, Washington Post, Mar 28, 2018
- Climate scientists debate a flaw in the Paris climate agreement by Dana Nuccitelli, Climate Consensus - The 97%, Guardian, Mar 29, 2018
- Partisan split on climate grows, even as U.S. fears are on the rise, poll finds by Steven Mufson, Energy & Environment, Washington Post, Mar 28, 2018
- Federal report: High-tide flooding could happen ‘every other day’ by late this century by Jason Samenow, Captial Weather Gang, Washington Post, Mar 28, 2018
Fri Mar 30, 2018
- How could global warming accelerate if CO2 is 'logarithmic'? by DPiepgrass, SkepticalScience, Mar 25, 2018
- The Sahara is growing, thanks in part to climate change by Darryl Fears, Energy & Environment, Washington Post, Mar 29, 2018
- About half of Americans don’t think climate change will affect them — here’s why by Alessandra Potenza, The Verge, Mar 29, 2018
- Federal Judge Dismisses Exxon Lawsuit Challenging State Climate Probes by Karen Savage, Climate Liability News, Mar 29, 2018
- Big Oil’s Business Model Could Be on the Verge of Failing by Geoff Dembicki, Vice, Mar 27, 2018
- Buried, altered, silenced: 4 ways government climate information has changed since Trump took office by Morgan Currie & Britt S. Paris, The Conversation US, Mar 24, 2018
- ‘We’re Talking Very Big Bucks’: New Bill Could Put Oil Companies on the Hook for Climate Change Costs by Jimmy Thomson, DeSmog Canada, Mar 28, 2018
- Mapped: Cambridge Analytica’s Ties to the Fossil Fuel Industry by Mat Hope, DeSmog UK, Mar 29, 2018
Sat Mar 31, 2018
- Why India’s CO2 emissions grew strongly in 2017, Guest Post by Robbie Andrews, Carbon Brief, Mar 28, 2018
- NOAA Report: Today’s Damaging Floods Will Be Tomorrow’s High Tides by Bob Henson, Category 6, Weather Underground, Mar 28, 2018
- In-depth: Is Shell’s new climate scenario as ‘radical’ as it says? by Simon Evans, Carbon Brief, Mar 29, 2018
- Trump distracts America from the task of facing three existential threats, Opinion by Michael H Fuchs, Guardian, Mar 30, 2018
- Independents Are Shifting To Climate Denial, According To The Latest Gallup Poll by Alexander C Kaufman, HuffPost, Mar 30, 2018
- Stanford law and science experts discuss court case that could set precedent for climate change litigation by Rob Jordon, Stanford News, Mar 30, 2018
- To Supercharge Chinese Renewables, Fix Their Financing by Miao Hong & Ye Wang, World Resources Insittute (WRI). Mar 27, 2018
- California Bans Climate-Warming HFCs in New Air-Conditioning and Refrigeration by Sabrina Shankman, InsideClimate News, Mar 30, 2018
from Skeptical Science https://ift.tt/2pTvcEZ