

Look for the moon near the planet Jupiter and the star Spica on June 30, July 1 and 2. Read more.
Three of the five bright planets are easy to see in July, 2017: Jupiter, Saturn and Venus. Bright Jupiter is the first “star” to pop into view at nightfall and stays out until late night. Golden Saturn is up in the east at nightfall and stays out for most of the night. Elusive Mercury is not as easy to catch after sunset, because it appears low in the west at dusk. Brilliant Venus rises before the sun, shining in front of the constellation Taurus the Bull. Red Mars, buried deep in the glare of evening twilight, cannot be seen from Earth this month. Follow the links below to learn more about the planets in July 2017.
Jupiter brightest “star” in evening sky
Saturn out nearly all night
Venus, brilliant in east at morning dawn
Mars lost in the sun’s glare
Mercury briefly visible after sunset
Like what EarthSky offers? Sign up for our free daily newsletter today!
Astronomy events, star parties, festivals, workshops
Visit a new EarthSky feature – Best Places to Stargaze – and add your fav.

Look for the moon in the vicinity of Jupiter and the nearby star Spica for several days, centered on June 28. Read more.
Jupiter brightest “star” in evening sky. Jupiter reached opposition on April 7. That is, it was opposite the sun as seen from Earth then and so was appearing in our sky all night. The giant planet came closest to Earth for 2017 one day later, on April 8. So Jupiter shone at its brightest and best in April, never fear. It’ll still be blazing away in July! Jupiter beams as the third-brightest celestial body in the nighttime sky, after the moon and Venus. In July, Jupiter shines from dusk until late evening or around midnight; meanwhile, Venus appears only before dawn.
Click here for an almanac telling you Jupiter’s setting time and Venus’ rising time in your sky.
Watch for the moon to join up with Jupiter for several days, centered on or near July 28. See the above sky chart. Wonderful sight!
From the Northern Hemisphere, Jupiter appears in the southwestern sky first thing at dusk; and from the Southern Hemisphere, Jupiter appears high overhead at dusk or nightfall. From all of Earth, Jupiter sinks in a westerly direction throughout the night, as Earth spins under the sky. In early July, Jupiter sets in the west around local midnight (midway between sunset and sunrise); by the month’s end, Jupiter sets some two hours earlier than local midnight.
Jupiter shines in front of the constellation Virgo, near Virgo’s sole 1st-magnitude star, called Spica.

Fernando Roquel Torres in Caguas, Puerto Rico captured Jupiter, the Great Red Spot (GRS) and all 4 of its largest moons – the Galilean satellites – on the date of Jupiter’s 2017 opposition (April 7).
If you have binoculars or a telescope, it’s fairly easy to see Jupiter’s four major moons, which look like pinpricks of light all on or near the same plane. They are often called the Galilean moons to honor Galileo, who discovered these great Jovian moons in 1610. In their order from Jupiter, these moons are Io, Europa, Ganymede and Callisto.
These moons orbit Jupiter around the Jovian equator. In cycles of six years, we view Jupiter’s equator edge-on. So, in 2015, we were able to view a number of mutual events involving Jupiter’s moons, through high-powered telescopes. Starting in late 2016, Jupiter’s axis began tilting enough toward the sun and Earth so that the farthest of these four moons, Callisto, has not been passing in front of Jupiter or behind Jupiter, as seen from our vantage point. This will continue for a period of about three years, during which time Callisto is perpetually visible to those with telescopes, alternately swinging above and below Jupiter as seen from Earth.
Click here for a Jupiter’s moons almanac, courtesy of skyandtelescope.com.

James Martin in Albuquerque, New Mexico caught this wonderful photo of Saturn on its June 15, 2017 opposition.

Let the moon guide you to the star Antares and the planet Saturn on July 5 and 6, 2017. Read more.
Saturn out nearly all night long. Saturn reached its yearly opposition on June 15. At opposition, Saturn came closest to Earth for the year, shone brightest in our sky and stayed out all night. It was highest up at midnight (midway between sunset and sunrise).
In July 2017, Saturn shines higher in the sky at nightfall than it did in June. Moreover, Saturn transits – climbs its highest point for the night – a few hours earlier than it did in June 2017. So, if you’re not a night owl, July actually presenst a better month for viewing Saturn, which is still shining at better than first-magnitude brightness.
Click here to find out Saturn’s transit time, when Saturn soars highest up for the night.
Look for Saturn above the horizon as soon as darkness falls. It’s in the southeast as seen from Earth’s Northern Hemisphere and more due east from the Southern Hemisphere. But your best view of Saturn, from either the Northern or Southern Hemisphere, is around 11 p.m. local time (midnight local daylight saving time) in early July and around 9 p.m. (10 p.m. daylight saving time) by the month’s end. That’s when Saturn climbs highest up for the night.
Be sure to let the moon guide you to Saturn (and the nearby star Antares) on July 5, July 6 and July 7.
Saturn, the farthest world that you can easily view with the eye alone, appears golden in color. It shines with a steady light.
Binoculars don’t reveal Saturn’s gorgeous rings, by the way, although binoculars will enhance Saturn’s color. To see the rings, you need a small telescope. A telescope will also reveal one or more of Saturn’s many moons, most notably Titan.
Saturn’s rings are inclined at nearly 27o from edge-on, exhibiting their northern face. In October 2017, the rings will open most widely for this year, displaying a maximum inclination of 27o.
As with so much in space (and on Earth), the appearance of Saturn’s rings from Earth is cyclical. In the year 2025, the rings will appear edge-on as seen from Earth. After that, we’ll begin to see the south side of Saturn’s rings, to increase to a maximum inclination of 27o by May 2032.
Click here for recommended almanacs; they can help you know when the planets rise, transit and set in your sky.

Jenney Disimon in Sabah, Borneo captured Venus before dawn.

Let the moon guide you to Venus and the star Aldebaran on July 19, 20 and 21. Read more.
Venus, brilliant in east at morning dawn Venus is always brilliant and beautiful, the brightest celestial body to light up our sky besides the sun and moon. If you’re an early bird, you can count on Venus to be your morning companion until nearly the end of 2017.
Venus reached a milestone as the morning “star” when it swung out to its greatest elongation from the sun on June 3, 2017. At this juncture, Venus was farthest from the sun on our sky’s dome, and the telescope showed Venus as half-illuminated in sunshine, like a first quarter moon. For the rest of the year, Venus will wax toward full phase.
Click here to know Venus’s present phase, remembering to select Venus as your object of interest.
Enjoy the picturesque coupling of the waning crescent moon and Venus in the eastern sky before sunrise on July 19 and July 20.
From mid-northern latitudes (U.S. and Europe), Venus rises about two and one-half hours before the sun. By the month’s end, it’ll increase to about three hours before sunrise.
At temperate latitudes in the Southern Hemisphere (Australia and South Africa), Venus rises about three and one-half hours before sunup in early July. By the month’s end that’ll taper to about two and one-half hours.
Click here for an almanac giving rising times of Venus in your sky.
The chart below helps to illustrate why we sometimes see Venus in the evening, and sometimes before dawn.
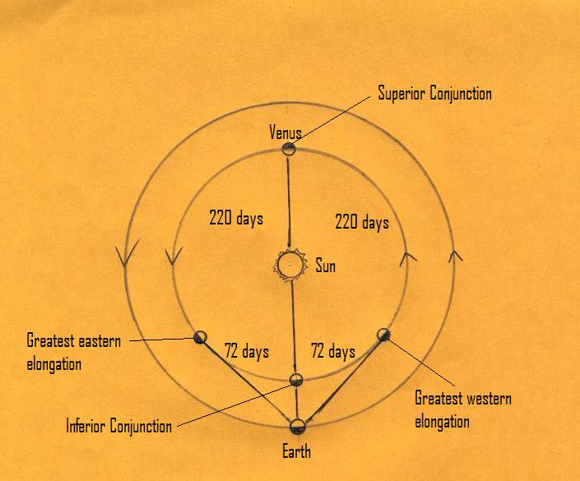
The Earth and Venus orbit the sun counterclockwise as seen from earthly north. When Venus is to the east (left) of the Earth-sun line, we see Venus as an evening “star” in the west after sunset. After Venus reaches its inferior conjunction, Venus then moves to the west (right) of the Earth-sun line, appearing as a morning “star” in the east before sunrise.

Mars, Mercury, Earth’s moon and the dwarf planet Ceres. Mars is smaller than Earth, but bigger than our moon. Image via NASA/JPL-Caltech/UCLA.
Mars lost in the sun’s glare. Mars, though nominally an evening object, is edging closer to the sunset day by day. Mars will transition out of the evening sky and into the morning sky on July 27, 2017, at which juncture Mars will be on the far side of the sun at what astronomers call superior conjunction.
Look for Mars to emerge in the east before dawn in late September or October 2017. The conjunction of Mars and Venus on October 5, 2017, will likely present the first view of Mars in the morning sky for many skywatchers.
Exactly one year after Mars’s superior conjunction on July 27, 2017, Mars will swing to opposition on July 27, 2018. This will be Mars’s best opposition since the historically close opposition on August 28, 2003. In fact, Mars will become the fourth-brightest heavenly body to light up the sky in July 2018, after the sun, moon and the planet Venus. It’s not often that Mars outshines Jupiter, normally the four-brightest celestial object.
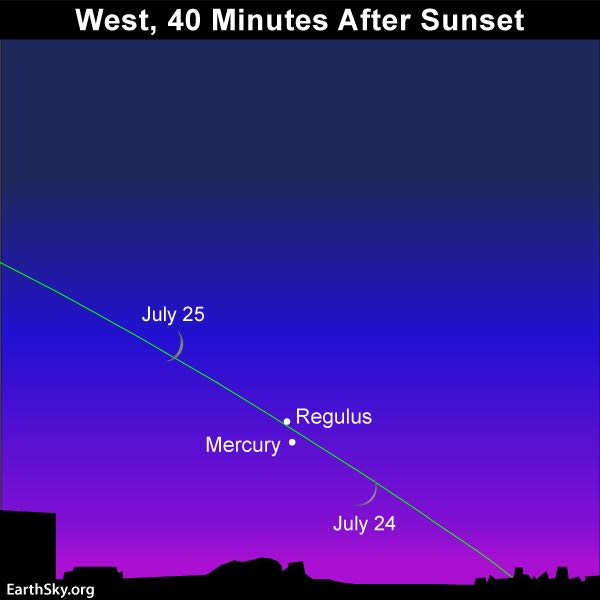
For a challenge, try to catch the young moon, the planet Mercury and the star Regulus at dusk on July 24 and 25. Binoculars could come in handy! Click here for an almanac giving you the setting time of the sun, moon and Mercury in your sky. Read more.
Mercury briefly visible after sunset. When we say Mercury is visible at only evening dusk, we’re really talking about the Northern Hemisphere. For the Southern Hemisphere, it’ll be the best evening apparition of Mercury for the year, with Mercury staying out until after nightfall at southerly latitudes. Look for Mercury low in the west, a good ways below Jupiter, as the evening twilight is giving way to nightfall.
Mercury is tricky. If you look too soon after sunset, Mercury will be obscured by evening twilight; if you look too late, it will have followed the sun beneath the horizon. Watch for Mercury low in the sky, and near the sunset point on the horizon, being mindful of Mercury’s setting time.
Throughout July, Mercury will move farther east of the setting sun day by day, and will reach its greatest eastern elongation as an evening “star” on July 30, 2017.
For a fun sky watching challenge, try to glimpse the young moon and Mercury in the western dusk on July 24 and July 25.
What do we mean by bright planet? By bright planet, we mean any solar system planet that is easily visible without an optical aid and that has been watched by our ancestors since time immemorial. In their outward order from the sun, the five bright planets are Mercury, Venus, Mars, Jupiter and Saturn. These planets actually do appear bright in our sky. They are typically as bright as – or brighter than – the brightest stars. Plus, these relatively nearby worlds tend to shine with a steadier light than the distant, twinkling stars. You can spot them, and come to know them as faithful friends, if you try.
Bottom line: In July 2017, Three of the five bright planets appear in the evening sky: Mercury, Jupiter and Saturn. Venus is found exclusively in the morning sky. Mars is lost in the sun’s glare.
Don’t miss anything. Subscribe to EarthSky News by email
Enjoy knowing where to look in the night sky? Please donate to help EarthSky keep going.
from EarthSky http://ift.tt/IJfHCr
Look for the moon near the planet Jupiter and the star Spica on June 30, July 1 and 2. Read more.
Three of the five bright planets are easy to see in July, 2017: Jupiter, Saturn and Venus. Bright Jupiter is the first “star” to pop into view at nightfall and stays out until late night. Golden Saturn is up in the east at nightfall and stays out for most of the night. Elusive Mercury is not as easy to catch after sunset, because it appears low in the west at dusk. Brilliant Venus rises before the sun, shining in front of the constellation Taurus the Bull. Red Mars, buried deep in the glare of evening twilight, cannot be seen from Earth this month. Follow the links below to learn more about the planets in July 2017.
Jupiter brightest “star” in evening sky
Saturn out nearly all night
Venus, brilliant in east at morning dawn
Mars lost in the sun’s glare
Mercury briefly visible after sunset
Like what EarthSky offers? Sign up for our free daily newsletter today!
Astronomy events, star parties, festivals, workshops
Visit a new EarthSky feature – Best Places to Stargaze – and add your fav.
Look for the moon in the vicinity of Jupiter and the nearby star Spica for several days, centered on June 28. Read more.
Jupiter brightest “star” in evening sky. Jupiter reached opposition on April 7. That is, it was opposite the sun as seen from Earth then and so was appearing in our sky all night. The giant planet came closest to Earth for 2017 one day later, on April 8. So Jupiter shone at its brightest and best in April, never fear. It’ll still be blazing away in July! Jupiter beams as the third-brightest celestial body in the nighttime sky, after the moon and Venus. In July, Jupiter shines from dusk until late evening or around midnight; meanwhile, Venus appears only before dawn.
Click here for an almanac telling you Jupiter’s setting time and Venus’ rising time in your sky.
Watch for the moon to join up with Jupiter for several days, centered on or near July 28. See the above sky chart. Wonderful sight!
From the Northern Hemisphere, Jupiter appears in the southwestern sky first thing at dusk; and from the Southern Hemisphere, Jupiter appears high overhead at dusk or nightfall. From all of Earth, Jupiter sinks in a westerly direction throughout the night, as Earth spins under the sky. In early July, Jupiter sets in the west around local midnight (midway between sunset and sunrise); by the month’s end, Jupiter sets some two hours earlier than local midnight.
Jupiter shines in front of the constellation Virgo, near Virgo’s sole 1st-magnitude star, called Spica.
Fernando Roquel Torres in Caguas, Puerto Rico captured Jupiter, the Great Red Spot (GRS) and all 4 of its largest moons – the Galilean satellites – on the date of Jupiter’s 2017 opposition (April 7).
If you have binoculars or a telescope, it’s fairly easy to see Jupiter’s four major moons, which look like pinpricks of light all on or near the same plane. They are often called the Galilean moons to honor Galileo, who discovered these great Jovian moons in 1610. In their order from Jupiter, these moons are Io, Europa, Ganymede and Callisto.
These moons orbit Jupiter around the Jovian equator. In cycles of six years, we view Jupiter’s equator edge-on. So, in 2015, we were able to view a number of mutual events involving Jupiter’s moons, through high-powered telescopes. Starting in late 2016, Jupiter’s axis began tilting enough toward the sun and Earth so that the farthest of these four moons, Callisto, has not been passing in front of Jupiter or behind Jupiter, as seen from our vantage point. This will continue for a period of about three years, during which time Callisto is perpetually visible to those with telescopes, alternately swinging above and below Jupiter as seen from Earth.
Click here for a Jupiter’s moons almanac, courtesy of skyandtelescope.com.
James Martin in Albuquerque, New Mexico caught this wonderful photo of Saturn on its June 15, 2017 opposition.
Let the moon guide you to the star Antares and the planet Saturn on July 5 and 6, 2017. Read more.
Saturn out nearly all night long. Saturn reached its yearly opposition on June 15. At opposition, Saturn came closest to Earth for the year, shone brightest in our sky and stayed out all night. It was highest up at midnight (midway between sunset and sunrise).
In July 2017, Saturn shines higher in the sky at nightfall than it did in June. Moreover, Saturn transits – climbs its highest point for the night – a few hours earlier than it did in June 2017. So, if you’re not a night owl, July actually presenst a better month for viewing Saturn, which is still shining at better than first-magnitude brightness.
Click here to find out Saturn’s transit time, when Saturn soars highest up for the night.
Look for Saturn above the horizon as soon as darkness falls. It’s in the southeast as seen from Earth’s Northern Hemisphere and more due east from the Southern Hemisphere. But your best view of Saturn, from either the Northern or Southern Hemisphere, is around 11 p.m. local time (midnight local daylight saving time) in early July and around 9 p.m. (10 p.m. daylight saving time) by the month’s end. That’s when Saturn climbs highest up for the night.
Be sure to let the moon guide you to Saturn (and the nearby star Antares) on July 5, July 6 and July 7.
Saturn, the farthest world that you can easily view with the eye alone, appears golden in color. It shines with a steady light.
Binoculars don’t reveal Saturn’s gorgeous rings, by the way, although binoculars will enhance Saturn’s color. To see the rings, you need a small telescope. A telescope will also reveal one or more of Saturn’s many moons, most notably Titan.
Saturn’s rings are inclined at nearly 27o from edge-on, exhibiting their northern face. In October 2017, the rings will open most widely for this year, displaying a maximum inclination of 27o.
As with so much in space (and on Earth), the appearance of Saturn’s rings from Earth is cyclical. In the year 2025, the rings will appear edge-on as seen from Earth. After that, we’ll begin to see the south side of Saturn’s rings, to increase to a maximum inclination of 27o by May 2032.
Click here for recommended almanacs; they can help you know when the planets rise, transit and set in your sky.
Jenney Disimon in Sabah, Borneo captured Venus before dawn.
Let the moon guide you to Venus and the star Aldebaran on July 19, 20 and 21. Read more.
Venus, brilliant in east at morning dawn Venus is always brilliant and beautiful, the brightest celestial body to light up our sky besides the sun and moon. If you’re an early bird, you can count on Venus to be your morning companion until nearly the end of 2017.
Venus reached a milestone as the morning “star” when it swung out to its greatest elongation from the sun on June 3, 2017. At this juncture, Venus was farthest from the sun on our sky’s dome, and the telescope showed Venus as half-illuminated in sunshine, like a first quarter moon. For the rest of the year, Venus will wax toward full phase.
Click here to know Venus’s present phase, remembering to select Venus as your object of interest.
Enjoy the picturesque coupling of the waning crescent moon and Venus in the eastern sky before sunrise on July 19 and July 20.
From mid-northern latitudes (U.S. and Europe), Venus rises about two and one-half hours before the sun. By the month’s end, it’ll increase to about three hours before sunrise.
At temperate latitudes in the Southern Hemisphere (Australia and South Africa), Venus rises about three and one-half hours before sunup in early July. By the month’s end that’ll taper to about two and one-half hours.
Click here for an almanac giving rising times of Venus in your sky.
The chart below helps to illustrate why we sometimes see Venus in the evening, and sometimes before dawn.
The Earth and Venus orbit the sun counterclockwise as seen from earthly north. When Venus is to the east (left) of the Earth-sun line, we see Venus as an evening “star” in the west after sunset. After Venus reaches its inferior conjunction, Venus then moves to the west (right) of the Earth-sun line, appearing as a morning “star” in the east before sunrise.
Mars, Mercury, Earth’s moon and the dwarf planet Ceres. Mars is smaller than Earth, but bigger than our moon. Image via NASA/JPL-Caltech/UCLA.
Mars lost in the sun’s glare. Mars, though nominally an evening object, is edging closer to the sunset day by day. Mars will transition out of the evening sky and into the morning sky on July 27, 2017, at which juncture Mars will be on the far side of the sun at what astronomers call superior conjunction.
Look for Mars to emerge in the east before dawn in late September or October 2017. The conjunction of Mars and Venus on October 5, 2017, will likely present the first view of Mars in the morning sky for many skywatchers.
Exactly one year after Mars’s superior conjunction on July 27, 2017, Mars will swing to opposition on July 27, 2018. This will be Mars’s best opposition since the historically close opposition on August 28, 2003. In fact, Mars will become the fourth-brightest heavenly body to light up the sky in July 2018, after the sun, moon and the planet Venus. It’s not often that Mars outshines Jupiter, normally the four-brightest celestial object.
For a challenge, try to catch the young moon, the planet Mercury and the star Regulus at dusk on July 24 and 25. Binoculars could come in handy! Click here for an almanac giving you the setting time of the sun, moon and Mercury in your sky. Read more.
Mercury briefly visible after sunset. When we say Mercury is visible at only evening dusk, we’re really talking about the Northern Hemisphere. For the Southern Hemisphere, it’ll be the best evening apparition of Mercury for the year, with Mercury staying out until after nightfall at southerly latitudes. Look for Mercury low in the west, a good ways below Jupiter, as the evening twilight is giving way to nightfall.
Mercury is tricky. If you look too soon after sunset, Mercury will be obscured by evening twilight; if you look too late, it will have followed the sun beneath the horizon. Watch for Mercury low in the sky, and near the sunset point on the horizon, being mindful of Mercury’s setting time.
Throughout July, Mercury will move farther east of the setting sun day by day, and will reach its greatest eastern elongation as an evening “star” on July 30, 2017.
For a fun sky watching challenge, try to glimpse the young moon and Mercury in the western dusk on July 24 and July 25.
What do we mean by bright planet? By bright planet, we mean any solar system planet that is easily visible without an optical aid and that has been watched by our ancestors since time immemorial. In their outward order from the sun, the five bright planets are Mercury, Venus, Mars, Jupiter and Saturn. These planets actually do appear bright in our sky. They are typically as bright as – or brighter than – the brightest stars. Plus, these relatively nearby worlds tend to shine with a steadier light than the distant, twinkling stars. You can spot them, and come to know them as faithful friends, if you try.
Bottom line: In July 2017, Three of the five bright planets appear in the evening sky: Mercury, Jupiter and Saturn. Venus is found exclusively in the morning sky. Mars is lost in the sun’s glare.
Don’t miss anything. Subscribe to EarthSky News by email
Enjoy knowing where to look in the night sky? Please donate to help EarthSky keep going.
from EarthSky http://ift.tt/IJfHCr