
All five bright planets start out as evening objects in September 2016, but two are hard to see. Mercury and Jupiter are quickly fading into the glare of sunset, and will move into the morning sky later this month. Venus, Mars and Saturn adorn the evening sky all through September. Venus is up just after sunset (setting before nightfall at northerly latitudes or shortly after dark in the Southern Hemisphere). The other two evening planets – Mars and Saturn – stay out until late evening at mid-northern latitudes (or until midnight or beyond as seen from the Southern Hemisphere). Mars is still bright, forming a noticeable triangle on the sky’s dome with Saturn and the bright star Antares. Follow the links below to learn more about September planets in 2016.
Brilliant Venus sets at dusk or early evening
Mercury in morning sky by late September
Jupiter shifts from evening to morning sky
Mars, dusk until mid-to-late evening, shines near Saturn
Saturn, dusk until mid-to-late evening, shines near Mars
Like what EarthSky offers? Sign up for our free daily newsletter today!
Astronomy events, star parties, festivals, workshops
Visit a new EarthSky feature – Best Places to Stargaze – and add your fav.

On September 2, 2016, the moon is near Jupiter, low in the west after sunset. Venus, 3rd-brightest sky object after sun and moon, might be your ticket to finding Jupiter (4th-brightest sky object). Or you might spot the moon first that night. From very northerly latitudes, bring your binoculars. The moon and Jupiter will be exceedingly near the sunset.

By September 3, 2016, the moon will be easy to see from all parts of Earth. It’ll still be near Venus and Jupiter, shortly after sunset. Look west!

On September 4, 5 and 6, the bow of the waxing crescent moon points toward the planets Venus and Jupiter. This month, Jupiter quickly falls into the glare of sunset while Venus slowly but surely climbs away. Read more.
Brilliant Venus sets at dusk or early evening . People have been reporting sightings of the brightest planet, Venus, in the west after sunset. It’s rather low in the twilight glare, but surprisingly bright for being so close to the horizon. Everyone on Earth has a shot at seeing it, but it’s easier from Earth’s Southern Hemisphere.
Watch for Venus near the moon on September 3. Binoculars will enhance the view!
Venus will become easier to see in the western evening sky in October, and even more so in November.
By the way, when Venus passed behind the sun in June, it passed directly behind it, as seen from Earth. That happened on June 6, 2016, and at that time Venus officially transitioned from our morning to our evening sky. Exactly four years previous to Venus’ passing directly behind the sun on June 6, 2016, Venus swung directly in front of the sun on June 6, 2012. You might remember that event: the widely watched transit of Venus, during which Venus crossed the sun’s face as seen from Earth (see photos). It was the last transit of Venus until December 11, 2117.

Here’s Venus, caught from a plane over southern Oregon, on July 28, 2016. Notice the bright twilight background. Photo by Gemini Brett.

The bow of the waning crescent moon points toward Mercury’s place over the sunrise point on the horizon. Mercury is more easily viewed in the Northern Hemisphere. Read more.
Mercury in morning sky by late September. Although Mercury may still be visible as an evening object from the Southern Hemisphere in early September, this fleet-footed planet will move out of the evening sky and into the morning sky by mid-September 2016. Mercury will swing to its greatest morning elongation from the sun on September 28, to present a fine morning apparition of Mercury in the Northern Hemisphere (and not so good for the Southern Hemisphere).
Fortunately, the waning crescent moon can help you locate Mercury at and near its greatest morning elongation on September 27, September 28 and September 29.
From northerly latitudes, Mercury may remain visible before sunrise for the first week or two during October 2016. If you are blessed with clear skies, you might even see the conjunction of Mercury and Jupiter on the morning of October 11, 2016. See the sky chart below.
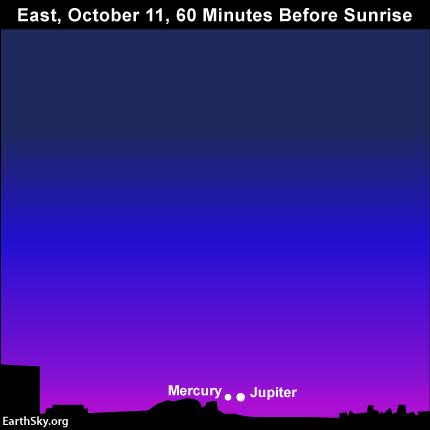
How many of you will see Mercury and Jupiter snuggling up together before sunrise on or near October 11, 2016?
Click here for recommended almanacs; they can give you Mercury’s rising time in your sky.

Look for the moon near Jupiter on August 5 and August 6. Binoculars could come in handy. The green line depicts the ecliptic – Earth’s orbital plane projected on the great dome of sky.
Jupiter shifts from evening to morning sky. From around the world, Jupiter quickly fades into the sunset and, for the most part, is lost in the glare of the sun throughout the month. Your best chance of spotting Jupiter this month is in the evening sky during the first few days of September. Southerly latitudes in the Southern Hemisphere are favored for seeing the last vestiges of Jupiter as an evening “star.”
If you are blessed with an unobstructed horizon in the direction of sunset, and crystal-clear skies, you might catch the young waxing crescent moon with Jupiter on or near September 2. the moon and Jupiter will be especially hard to see from northerly latitudes, so have binoculars handy!
Venus, the third-brightest celestial object, after sun and moon, may be your ticket to finding Jupiter, the fourth-brightest celestial body. At northerly latitudes, you’ll probably need binoculars to view the moon and Jupiter on this date.
After Jupiter disappears from evening sky in early September, its reappearance in the morning sky will come sometime in October 2016.

View larger | Mikhail Chubarets in the Ukraine made this chart. It shows the view of Mars through a telescope in 2016. We never see Mars as a disk like this with the eye alone. But you can see why Mars has been so bright to the eye in 2016.
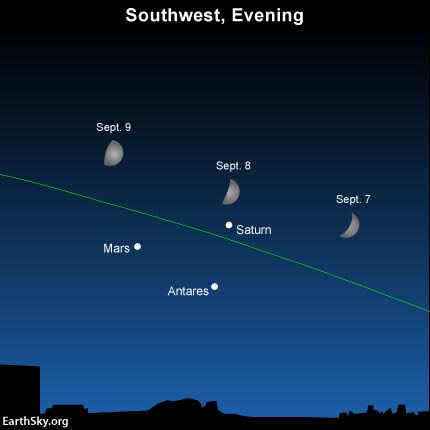
Look for the moon near Saturn, Antares and Mars as darkness falls on September 7, 8 and 9. Read more.
Mars, dusk until mid-to-late evening, shines near Saturn. Mars is still bright this month, though fainter than it was earlier in 2016! Saturn came closest to Earth for the year on June 3, less than four days after Mars’ closest approach to Earth on May 30. Although Mars and Saturn are beginning to fade a bit, they’re still plenty bright and easy to see – especially Mars!
Mars was at its brightest at its opposition on May 22. Although Mars has faded since its glory days in May and June 2016, Mars is nonetheless respectably bright, shining on par with the sky’s brightest stars.
Looking for a sky almanac? EarthSky recommends…
Here’s some really good news, though. Mars is near another planet on the sky’s dome, Saturn. Look for Mars and Saturn near Antares, the brightest star in the constellation Scorpius the Scorpion. They make a noticeable triangle on the sky’s dome.
Let the moon help guide your eye to Mars (plus Saturn and the bright star Antares) for several evenings, centered on or near September 9.

Use the moon on to find the colorful threesome – Mars, Saturn and Antares – on September 8. Read more.
Saturn, dusk until mid-to-late evening, shines near Saturn. Both Mars and Saturn are near a fainter object – still one of the sky’s brightest stars – Antares in the constellation Scorpius.
The ringed planet starts out the month appearing in the southwest sky at nightfall. Although Saturn appears respectably bright, its brilliance can’t match that of Mars. Look for Saturn near Mars, even though Mars moves farther away from Saturn (and the star Antares) all month long. These two worlds form a bright celestial triangle with the star Antares in the September night sky. Mars is brighter than Saturn, which in turn is brighter than Antares.
Watch for the moon to swing by Saturn for several days, centered on or near September 8.
Saturn, the farthest world that you can easily view with the eye alone, appears golden in color. It shines with a steady light. Binoculars don’t reveal Saturn’s gorgeous rings, by the way, although binoculars will enhance Saturn’s golden color. To see the rings, you need a small telescope. A telescope will also reveal one or more of Saturn’s many moons, most notably Titan.

Tom Wildoner over-exposed Saturn itself to capture this view of Saturn’s moons on June 25, 2016. Visit Tom at LeisurelyScientist.com.
Saturn’s rings are inclined at a little more than 26o from edge-on in August 2016, exhibiting their northern face. Next year, in October 2017, the rings will open most widely, displaying a maximum inclination of 27o.
As with so much in space (and on Earth), the appearance of Saturn’s rings from Earth is cyclical. In the year 2025, the rings will appear edge-on as seen from Earth. After that, we’ll begin to see the south side of Saturn’s rings, to increase to a maximum inclination of 27o by May 2032.
Click here for recommended almanacs. They can help you know when the planets rise, transit and set in your sky
What do we mean by bright planet? By bright planet, we mean any solar system planet that is easily visible without an optical aid and that has been watched by our ancestors since time immemorial. In their outward order from the sun, the five bright planets are Mercury, Venus, Mars, Jupiter and Saturn. These planets actually do appear bright in our sky. They are typically as bright as – or brighter than – the brightest stars. Plus, these relatively nearby worlds tend to shine with a steadier light than the distant, twinkling stars. You can spot them, and come to know them as faithful friends, if you try.
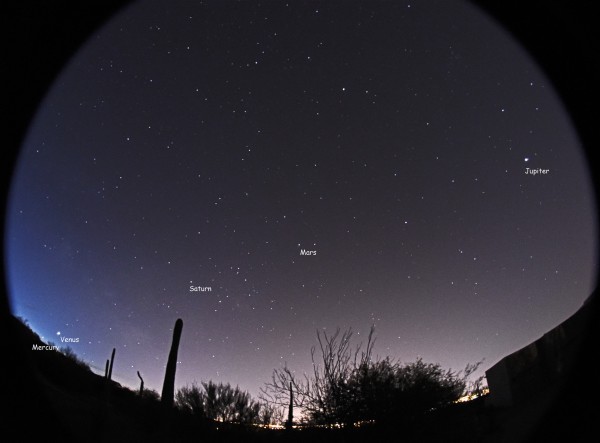
From late January, and through mid-February, 5 bright planets were visible at once in the predawn sky. This image is from February 8, 2016. It’s by Eliot Herman in Tucson, Arizona. View on Flickr.
Bottom line: In August 2016, Jupiter starts out the month above Mercury and Venus in the western evening sky. Toward the end of the month, Venus climbs above Mercury and then Jupiter. Saturn and the bright star Antares make a triangle with Mars on the sky’s dome, shining from dusk until late night.
Easily locate stars and constellations with EarthSky’s planisphere.
Don’t miss anything. Subscribe to EarthSky News by email
from EarthSky http://ift.tt/IJfHCr
All five bright planets start out as evening objects in September 2016, but two are hard to see. Mercury and Jupiter are quickly fading into the glare of sunset, and will move into the morning sky later this month. Venus, Mars and Saturn adorn the evening sky all through September. Venus is up just after sunset (setting before nightfall at northerly latitudes or shortly after dark in the Southern Hemisphere). The other two evening planets – Mars and Saturn – stay out until late evening at mid-northern latitudes (or until midnight or beyond as seen from the Southern Hemisphere). Mars is still bright, forming a noticeable triangle on the sky’s dome with Saturn and the bright star Antares. Follow the links below to learn more about September planets in 2016.
Brilliant Venus sets at dusk or early evening
Mercury in morning sky by late September
Jupiter shifts from evening to morning sky
Mars, dusk until mid-to-late evening, shines near Saturn
Saturn, dusk until mid-to-late evening, shines near Mars
Like what EarthSky offers? Sign up for our free daily newsletter today!
Astronomy events, star parties, festivals, workshops
Visit a new EarthSky feature – Best Places to Stargaze – and add your fav.
On September 2, 2016, the moon is near Jupiter, low in the west after sunset. Venus, 3rd-brightest sky object after sun and moon, might be your ticket to finding Jupiter (4th-brightest sky object). Or you might spot the moon first that night. From very northerly latitudes, bring your binoculars. The moon and Jupiter will be exceedingly near the sunset.
By September 3, 2016, the moon will be easy to see from all parts of Earth. It’ll still be near Venus and Jupiter, shortly after sunset. Look west!
On September 4, 5 and 6, the bow of the waxing crescent moon points toward the planets Venus and Jupiter. This month, Jupiter quickly falls into the glare of sunset while Venus slowly but surely climbs away. Read more.
Brilliant Venus sets at dusk or early evening . People have been reporting sightings of the brightest planet, Venus, in the west after sunset. It’s rather low in the twilight glare, but surprisingly bright for being so close to the horizon. Everyone on Earth has a shot at seeing it, but it’s easier from Earth’s Southern Hemisphere.
Watch for Venus near the moon on September 3. Binoculars will enhance the view!
Venus will become easier to see in the western evening sky in October, and even more so in November.
By the way, when Venus passed behind the sun in June, it passed directly behind it, as seen from Earth. That happened on June 6, 2016, and at that time Venus officially transitioned from our morning to our evening sky. Exactly four years previous to Venus’ passing directly behind the sun on June 6, 2016, Venus swung directly in front of the sun on June 6, 2012. You might remember that event: the widely watched transit of Venus, during which Venus crossed the sun’s face as seen from Earth (see photos). It was the last transit of Venus until December 11, 2117.
Here’s Venus, caught from a plane over southern Oregon, on July 28, 2016. Notice the bright twilight background. Photo by Gemini Brett.
The bow of the waning crescent moon points toward Mercury’s place over the sunrise point on the horizon. Mercury is more easily viewed in the Northern Hemisphere. Read more.
Mercury in morning sky by late September. Although Mercury may still be visible as an evening object from the Southern Hemisphere in early September, this fleet-footed planet will move out of the evening sky and into the morning sky by mid-September 2016. Mercury will swing to its greatest morning elongation from the sun on September 28, to present a fine morning apparition of Mercury in the Northern Hemisphere (and not so good for the Southern Hemisphere).
Fortunately, the waning crescent moon can help you locate Mercury at and near its greatest morning elongation on September 27, September 28 and September 29.
From northerly latitudes, Mercury may remain visible before sunrise for the first week or two during October 2016. If you are blessed with clear skies, you might even see the conjunction of Mercury and Jupiter on the morning of October 11, 2016. See the sky chart below.
How many of you will see Mercury and Jupiter snuggling up together before sunrise on or near October 11, 2016?
Click here for recommended almanacs; they can give you Mercury’s rising time in your sky.
Look for the moon near Jupiter on August 5 and August 6. Binoculars could come in handy. The green line depicts the ecliptic – Earth’s orbital plane projected on the great dome of sky.
Jupiter shifts from evening to morning sky. From around the world, Jupiter quickly fades into the sunset and, for the most part, is lost in the glare of the sun throughout the month. Your best chance of spotting Jupiter this month is in the evening sky during the first few days of September. Southerly latitudes in the Southern Hemisphere are favored for seeing the last vestiges of Jupiter as an evening “star.”
If you are blessed with an unobstructed horizon in the direction of sunset, and crystal-clear skies, you might catch the young waxing crescent moon with Jupiter on or near September 2. the moon and Jupiter will be especially hard to see from northerly latitudes, so have binoculars handy!
Venus, the third-brightest celestial object, after sun and moon, may be your ticket to finding Jupiter, the fourth-brightest celestial body. At northerly latitudes, you’ll probably need binoculars to view the moon and Jupiter on this date.
After Jupiter disappears from evening sky in early September, its reappearance in the morning sky will come sometime in October 2016.
View larger | Mikhail Chubarets in the Ukraine made this chart. It shows the view of Mars through a telescope in 2016. We never see Mars as a disk like this with the eye alone. But you can see why Mars has been so bright to the eye in 2016.
Look for the moon near Saturn, Antares and Mars as darkness falls on September 7, 8 and 9. Read more.
Mars, dusk until mid-to-late evening, shines near Saturn. Mars is still bright this month, though fainter than it was earlier in 2016! Saturn came closest to Earth for the year on June 3, less than four days after Mars’ closest approach to Earth on May 30. Although Mars and Saturn are beginning to fade a bit, they’re still plenty bright and easy to see – especially Mars!
Mars was at its brightest at its opposition on May 22. Although Mars has faded since its glory days in May and June 2016, Mars is nonetheless respectably bright, shining on par with the sky’s brightest stars.
Looking for a sky almanac? EarthSky recommends…
Here’s some really good news, though. Mars is near another planet on the sky’s dome, Saturn. Look for Mars and Saturn near Antares, the brightest star in the constellation Scorpius the Scorpion. They make a noticeable triangle on the sky’s dome.
Let the moon help guide your eye to Mars (plus Saturn and the bright star Antares) for several evenings, centered on or near September 9.
Use the moon on to find the colorful threesome – Mars, Saturn and Antares – on September 8. Read more.
Saturn, dusk until mid-to-late evening, shines near Saturn. Both Mars and Saturn are near a fainter object – still one of the sky’s brightest stars – Antares in the constellation Scorpius.
The ringed planet starts out the month appearing in the southwest sky at nightfall. Although Saturn appears respectably bright, its brilliance can’t match that of Mars. Look for Saturn near Mars, even though Mars moves farther away from Saturn (and the star Antares) all month long. These two worlds form a bright celestial triangle with the star Antares in the September night sky. Mars is brighter than Saturn, which in turn is brighter than Antares.
Watch for the moon to swing by Saturn for several days, centered on or near September 8.
Saturn, the farthest world that you can easily view with the eye alone, appears golden in color. It shines with a steady light. Binoculars don’t reveal Saturn’s gorgeous rings, by the way, although binoculars will enhance Saturn’s golden color. To see the rings, you need a small telescope. A telescope will also reveal one or more of Saturn’s many moons, most notably Titan.
Tom Wildoner over-exposed Saturn itself to capture this view of Saturn’s moons on June 25, 2016. Visit Tom at LeisurelyScientist.com.
Saturn’s rings are inclined at a little more than 26o from edge-on in August 2016, exhibiting their northern face. Next year, in October 2017, the rings will open most widely, displaying a maximum inclination of 27o.
As with so much in space (and on Earth), the appearance of Saturn’s rings from Earth is cyclical. In the year 2025, the rings will appear edge-on as seen from Earth. After that, we’ll begin to see the south side of Saturn’s rings, to increase to a maximum inclination of 27o by May 2032.
Click here for recommended almanacs. They can help you know when the planets rise, transit and set in your sky
What do we mean by bright planet? By bright planet, we mean any solar system planet that is easily visible without an optical aid and that has been watched by our ancestors since time immemorial. In their outward order from the sun, the five bright planets are Mercury, Venus, Mars, Jupiter and Saturn. These planets actually do appear bright in our sky. They are typically as bright as – or brighter than – the brightest stars. Plus, these relatively nearby worlds tend to shine with a steadier light than the distant, twinkling stars. You can spot them, and come to know them as faithful friends, if you try.
From late January, and through mid-February, 5 bright planets were visible at once in the predawn sky. This image is from February 8, 2016. It’s by Eliot Herman in Tucson, Arizona. View on Flickr.
Bottom line: In August 2016, Jupiter starts out the month above Mercury and Venus in the western evening sky. Toward the end of the month, Venus climbs above Mercury and then Jupiter. Saturn and the bright star Antares make a triangle with Mars on the sky’s dome, shining from dusk until late night.
Easily locate stars and constellations with EarthSky’s planisphere.
Don’t miss anything. Subscribe to EarthSky News by email
from EarthSky http://ift.tt/IJfHCr